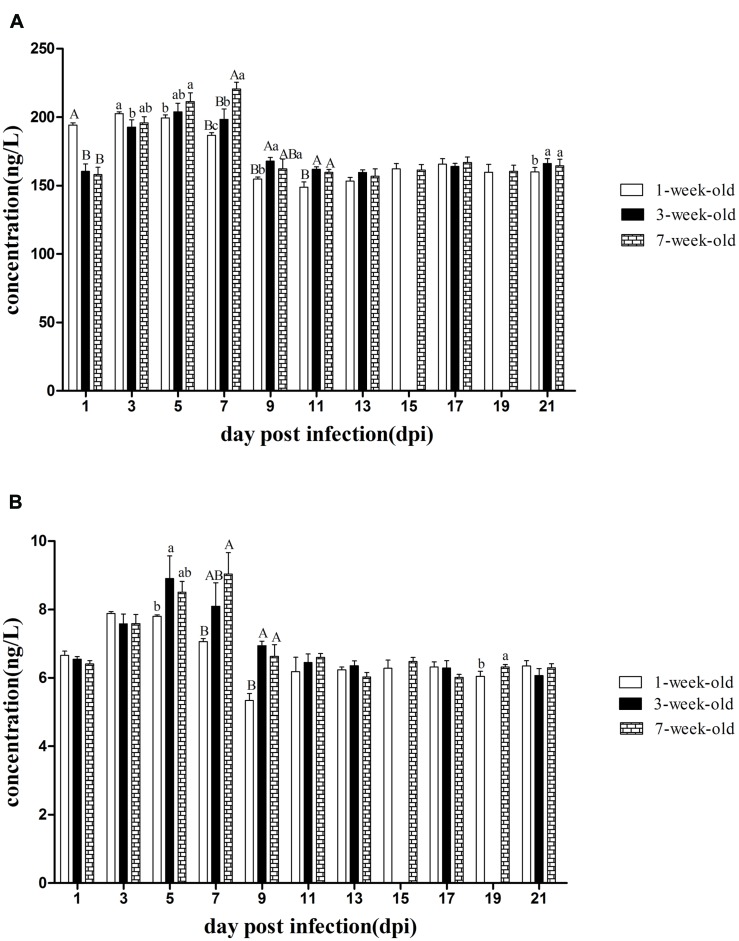
FIGURE 4.
The kinetics of IFN-γ and IL-2 in serum of different age ducks infected with DTMUV. (A) IFN-γ levels of serum from all the infected ducks. (B) IL-2 levels of serum from all the infected ducks. The samples of 3-weeks-old ducks were not collected at 15 and 19 dpi. Data are expressed as mean ± SD (n = 3). Each sample was analyzed in triplicate. In each panel, different capital letters mean highly significant difference (P < 0.01), and different small letters mean significant difference (P < 0.05), while no letters mean no significant difference (P > 0.05). Significant differences were calculated by ANOVA with Duncan’s multiple range test.

