Fig. 3.

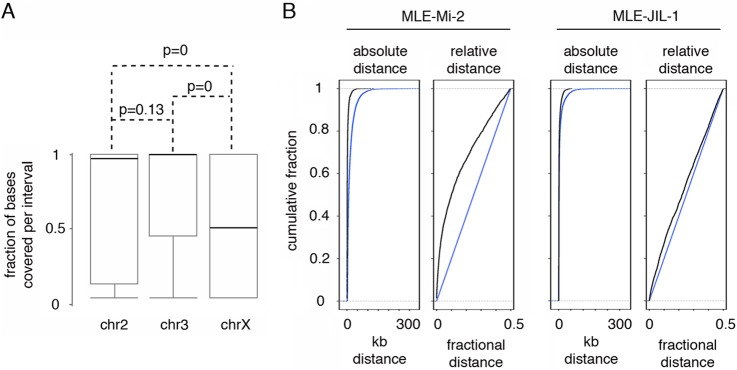
MLE and Mi-2 ChIP-chip data analysis. A, Box plot showing Mi-2 coverage of MLE enriched regions in S2 cells. The median Mi-2 coverage of MLE sites on the second (chr2) and third (chr3) chromosomes is ∼1, indicating that the majority of MLE intervals lies on Mi-2-enriched regions. In the X chromosome the median is ∼0.5, indicating a poor correlation between MLE and Mi-2, likely because of the prevalent association of MLE with the MSL complex on this chromosome. The black lines represent the medians. B, GenometriCorr analysis of MLE sites on the second and third chromosomes versus Mi-2 or JIL-1 sites. ECDF plots of absolute distance and relative distance tests show a greater correlation between MLE and Mi-2 interval midpoints than MLE and JIL-1. Blue lines represent the estimated distributions of uncorrelated data, black lines show the distributions of the experimental data.
