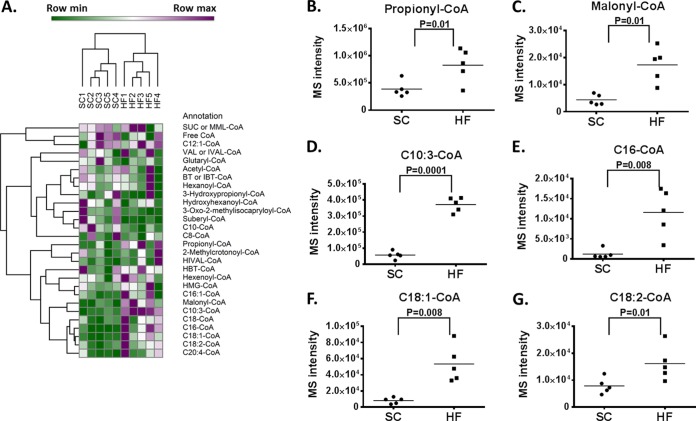
Fig. 3.
Acyl-CoA profiling in standard chow and high fat diet fed mouse liver. Five standard chow (SC) and five high fat diet (HF) fed mouse liver samples were used for acyl-CoA and other metabolites analysis. A, Hierarchical clustering of 10 samples based on relative MS intensity of acyl-CoA compounds. B to G, Dot plots of four acyl-CoA compounds with large changes in HF samples compared with SC liver samples.

