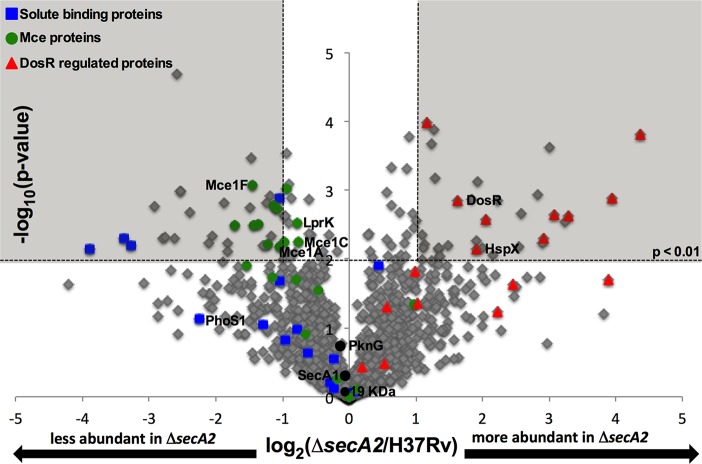
Fig. 2.
Relative quantitation of proteins in H37Rv and ΔsecA2 mutant cell wall-fractions. Ratios for the 1300 proteins having average spectral counts of ≥4 in H37Rv and/or ΔsecA2 are shown plotted by log2 (ΔsecA2/H37Rv) and −log10(p value). The shaded area of the graph indicates proteins showing twofold differences, p < 0.01. Solute binding proteins (blue squares), Mce transporter proteins (green circles), and DosR-regulated proteins (red triangles) are marked on the plot, and proteins later validated are identified. In addition, SecA1, is identified on the plot as a protein expected to be present in similar amounts between strains (54).

