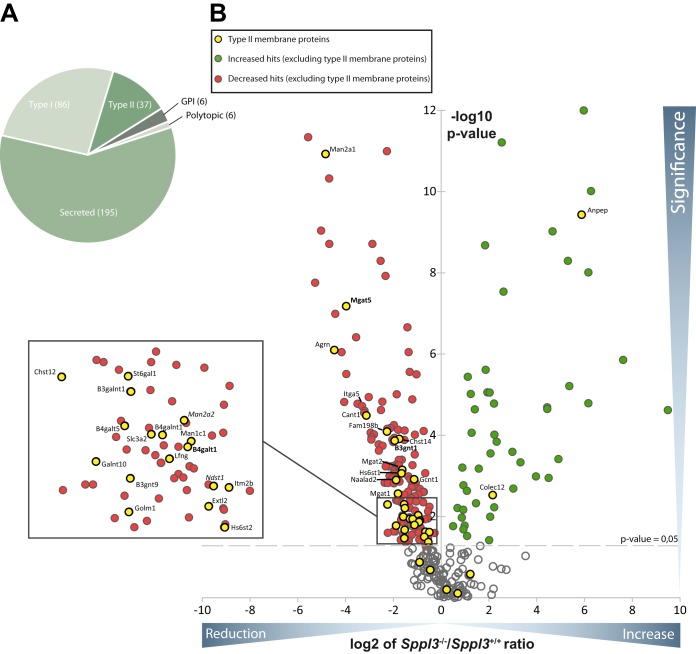
Fig. 3.
Secretome analysis of Sppl3-deficient MEF. A, Pie chart of all glycoproteins which have been identified in at least four out of five biological replicates of the MEF secretome subdivided according to their topology and the presence of a transmembrane domain. B, Volcano plot: Plotted is the values of the negative lg of the p value of log2 intensity ratios (y axis) versus the log2 ratio of intensity values of Sppl3 knockout MEF and wild type MEF (x axis) of a given identified protein. The interspaced light gray line defines the significance level of p = 0.05. Type II membrane proteins were almost exclusively reduced and thus clustered in the left half of the volcano. The previously identified substrates are given in bold, those also identified in the SPPL3 overexpression secretome analysis in italics.

