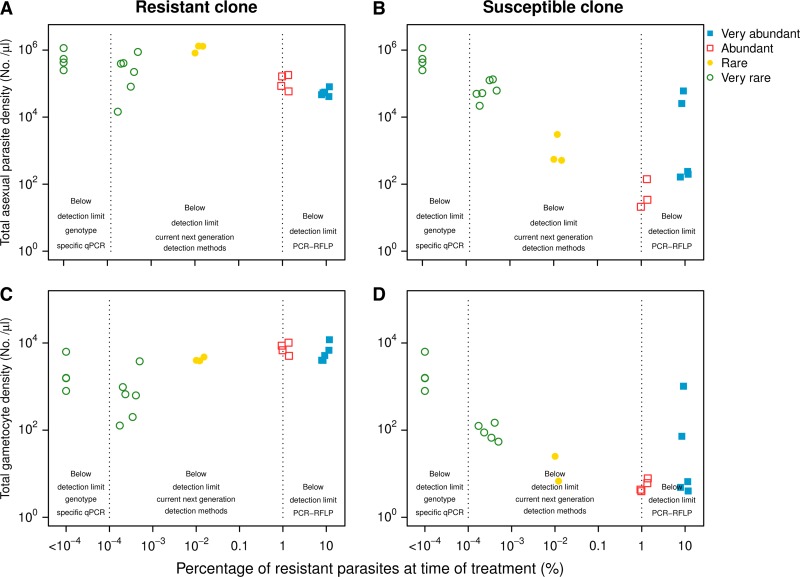
Figure 3.
Total posttreatment recrudescence density (days 10–49 postinfection) of resistant (left panels) and susceptible (right panels) asexual parasites (top row) and gametocytes (bottom row) by percentage of resistant asexual parasites at start of treatment. Infections were initiated with very abundant (filled squares), abundant (open squares), rare (filled circles), and very rare (open circles) resistant parasites. Dotted vertical line indicates the detection limits of various molecular detection techniques (see introduction).

