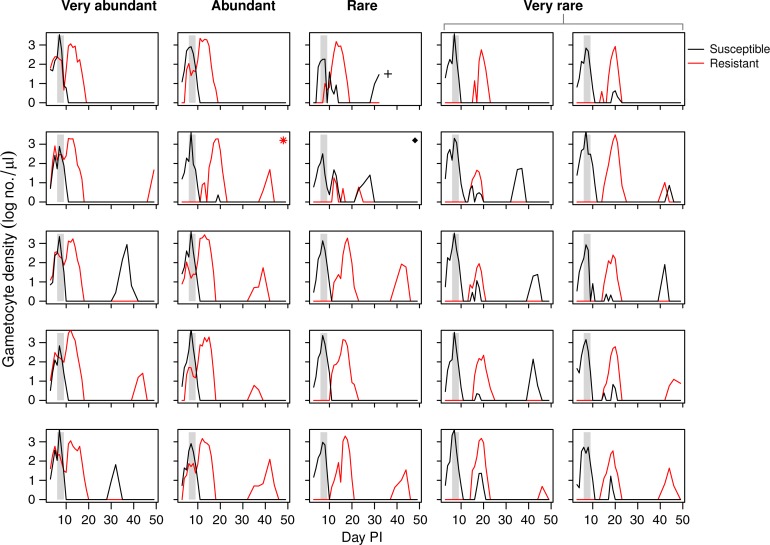
Figure 5.
Gametocyte dynamics of resistant and susceptible parasites depicted separately for each individual mouse that received an inoculum with very abundant, abundant, rare, or very rare resistant parasites (see column headings). Vertical grey areas show timing and duration of treatment. Asterisk indicates a mouse that received a lower dose of resistant parasites than intended, the cross indicates a mouse that died during the infection, and the diamond indicates a mouse that did not respond to treatment because of unknown reasons. These three mice were excluded from the analysis (see Methods and Table 1).

