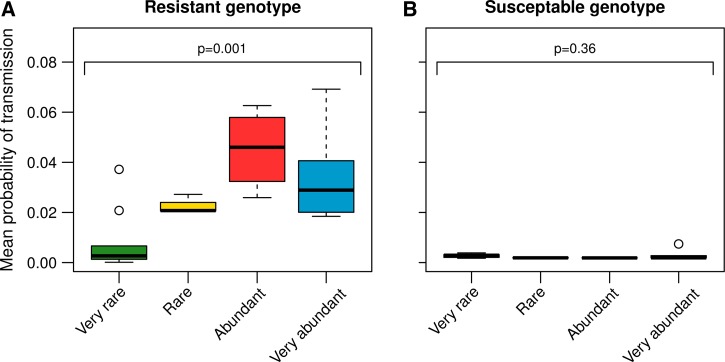
Figure 6.
Posttreatment (day 10–49 postinfection) probability of infecting mosquitoes with resistant (A) and susceptible (B) genotypes, estimated from an empirically derived gametocyte density—infectivity relationship (see Materials and Methods). Box plots show median, first, and third quartile of estimations and the whiskers indicate maximum and minimum estimations or 1.5 × interquartile range out of which case outliers are plotted. Sample sizes are as in Table 1.

