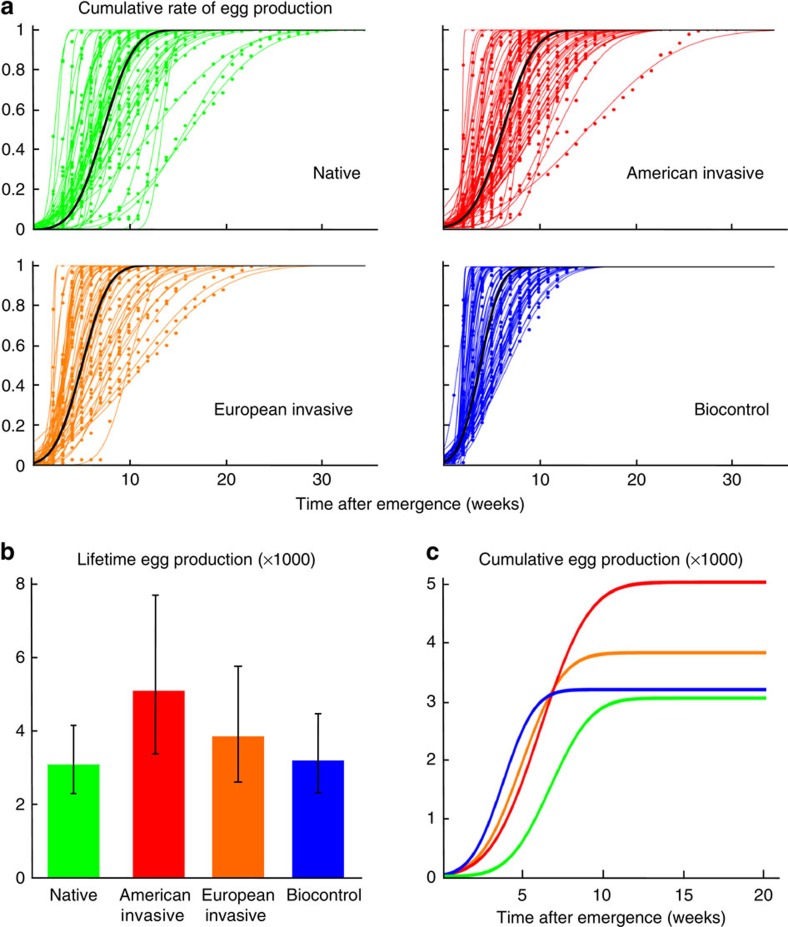
Figure 2. Lifetime dynamics of egg production in the four different origins of H. axyridis.
(a) Temporal allocation of egg production. Coloured points and curves represent individuals' cumulative proportion of eggs produced over time. For each individual, data were fitted with the cumulative density function of a normal distribution with mean μ and standard deviation σ. Black curves were obtained using the average values of μ and σ in each type of population. (b) Mean lifetime egg production per type of population (with 95% confidence intervals). Data are from 242 individuals (nBeijing=27, nFuchang=28; nChili=27, nUSA=40; nBudapest=25, nBrussels=26; nBiotop=42, nBiobest=27). (c) Schematic representation of lifetime dynamics of egg production within each type of population. The curves were obtained as the product of average allocation schedules (black curves in a) and average lifetime fecundities (b).

