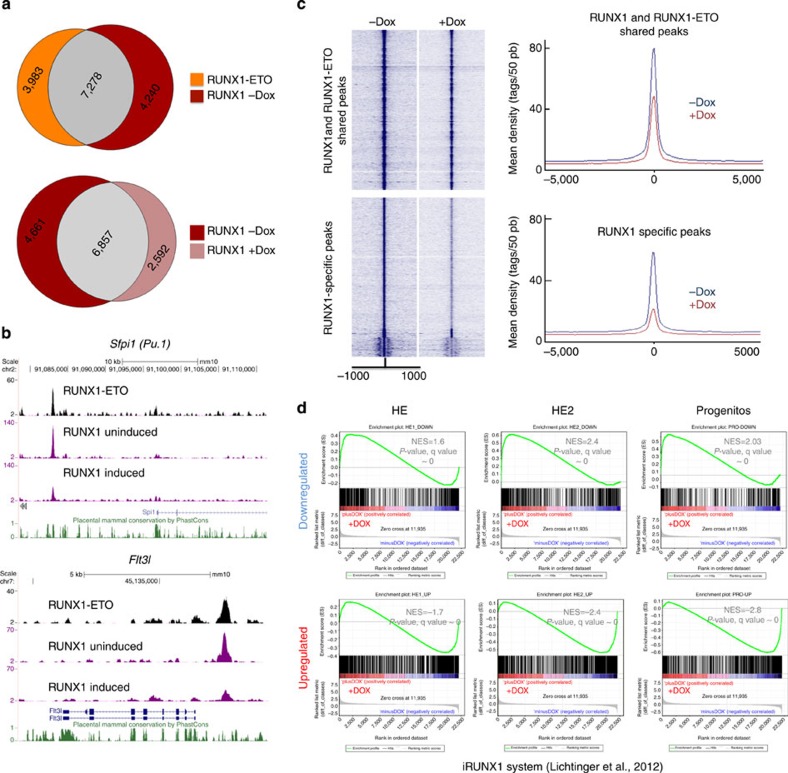
Figure 7. RUNX1-ETO causes the disruption of pre-existing RUNX1 complexes and interferes with the activating and repressive function of RUNX1.
(a) Venn diagram showing the overlap of RUNX1-ETO and RUNX1 ChIP-seq peaks in the cultured progenitors after induction (top). The bottom diagram shows the overlap of the RUNX1 peaks in the uninduced and the induced cultured progenitors. (b) Screenshots showing a reduction in RUNX1 ChIP-seq peaks across the indicated loci. (c) Composite RUNX1 ChIP-seq peak distribution profiles within 1 kb of the peak centre. The top diagram shows the relative tag densities for the peaks shared between the uninduced and the induced progenitors in blue and brown, respectively. The bottom diagram shows the reduction in tag densities of the RUNX1-specific peaks in the uninduced cultures. (d) GSEAs correlating the gene expression profiles at the indicated stages with or without RUNX1-ETO obtained in this study with those from RUNX1 knockout HE with or without induction of RUNX1 (ref. 17), demonstrating an inverse correlation of responses.

