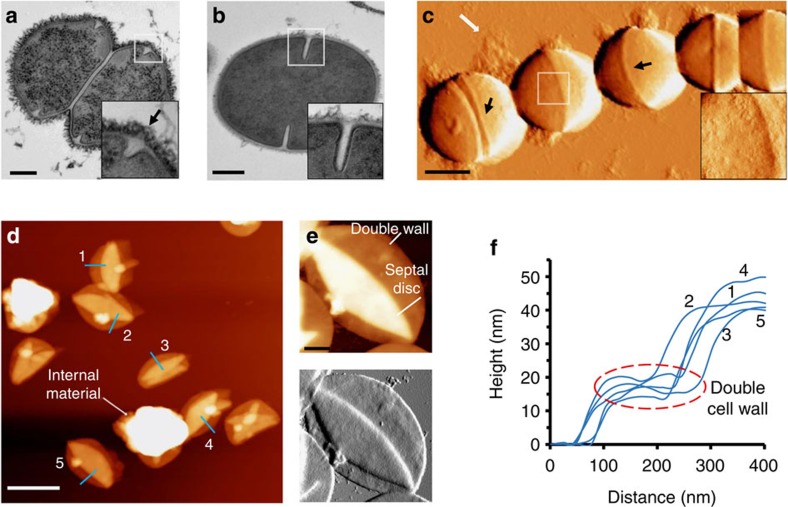
Figure 1. GBS cell-wall morphology.
(a,b) Transmission electron microscopy images of a divided cell and b non-divided cell (scale bars, 200 nm). (c) Force-error AFM images of GBS chain in ambient conditions showing cell-wall molecules at the periphery (white arrow) and covering the surface (inset; scale bar, 500 nm). (d) Topography of isolated PG sacculi imaged by AFM in ambient conditions (scale bars, 1 μm; height, 85 nm). (e) Representative high-resolution topography (upper) and force-error (lower) images of sacculus do not show PG bands (scale bar, 150 nm; height of upper image is 50 nm). (f) Representative height profiles of PG sacculi corresponding to the blue lines in d. Black arrows in a (inset) and c mark the equatorial rings.

