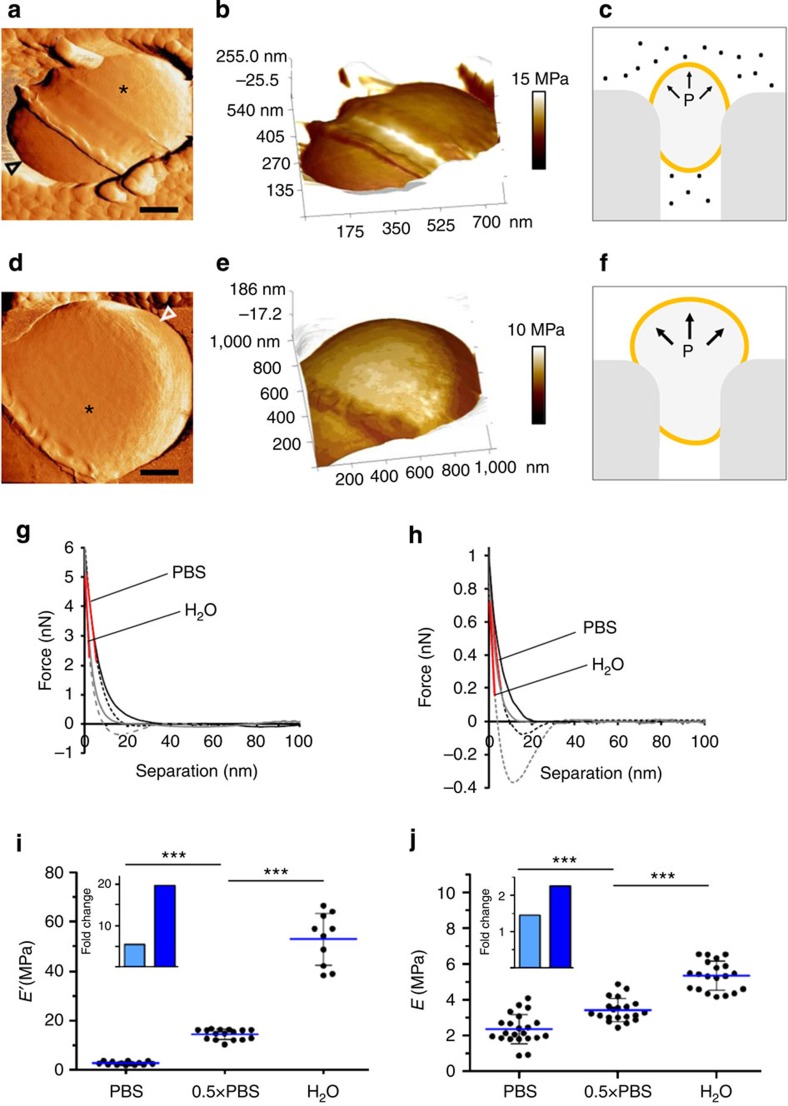
Figure 2. Elevation in turgor pressure reduces the cell-wall elasticity.
(a,d) Force-error images of single pore-trapped GBS in PBS and in ultrapure water, respectively (scale bar, 200 nm). (b,e) Directly correlated elastic moduli calculated from a 1 nN peak-force scan and rendered on a 3D height representation of bacteria in PBS and ultrapure water, respectively. (c,f) Illustration showing pore-trapped bacteria in high or low medium osmolarity, respectively. Elevation in turgor pressure (P) results in a higher force that swells the exposed surface. (g,h) Representative force–distance curves recorded from a spot marked in the force-error images using g high and h low peak force (PBS represented by black line and water by grey line; Solid lines are approach and dashed lines are retraction curves; Red line is linear fit region, R2>0.98). (i,j) Elastic moduli of bacteria imaged using i 6 nN peak force (E′) and j 1 nN peak force (E) (average±s.d.; ***P value<0.0001, two-tailed unpaired t-test; insets show changes in elasticity in 0.5 × PBS (light blue) and water (dark blue) relative to PBS).

