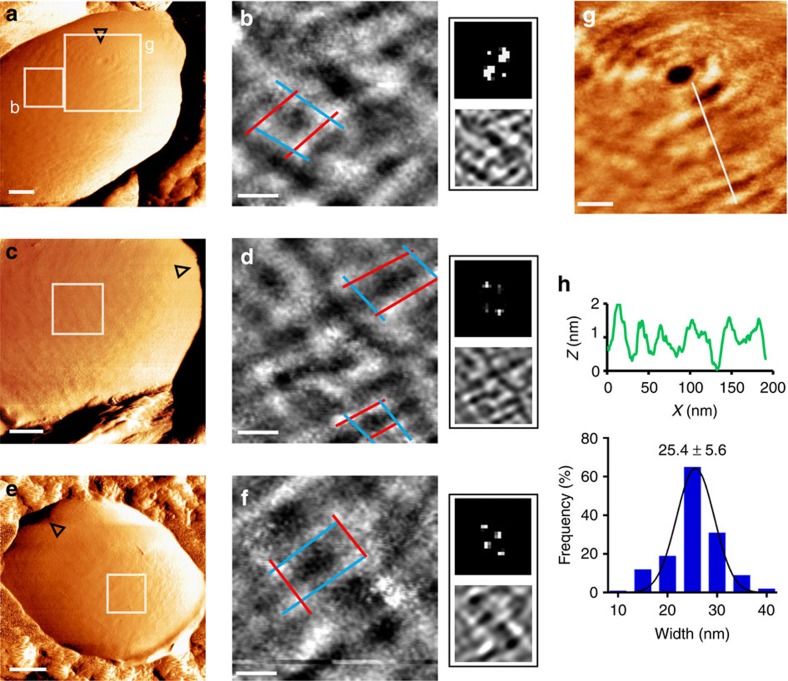
Figure 3. High-resolution imaging reveals a nanoscale net-like surface architecture.
(a,c,e) Low-magnification force-error images recorded in PBS using 1 nN peak force show circumferential surface bands (scale bars, 100 nm; open triangles point towards the pole). (b,d,f) High-magnification height images show a net-like surface topography (scale bars, 30 nm; height, 1.2 nm). Colour lines demonstrate single holes formed by circumferential (blue) and connecting (red) bands. On the right of each image are a corresponding 2D-FFT map (upper) and a 2D-FFT filtered image (lower). (g) Height image, from a place marked in a, shows circular arrangement of bands around the pole (scale bar, 50 nm; height, 2.5 nm). (h) Representative height profile (upper) from a cross-section in g, and statistical analysis of band widths (histogram and an average±s.d.; n=35 bands per cell, from N=20 bacteria).

