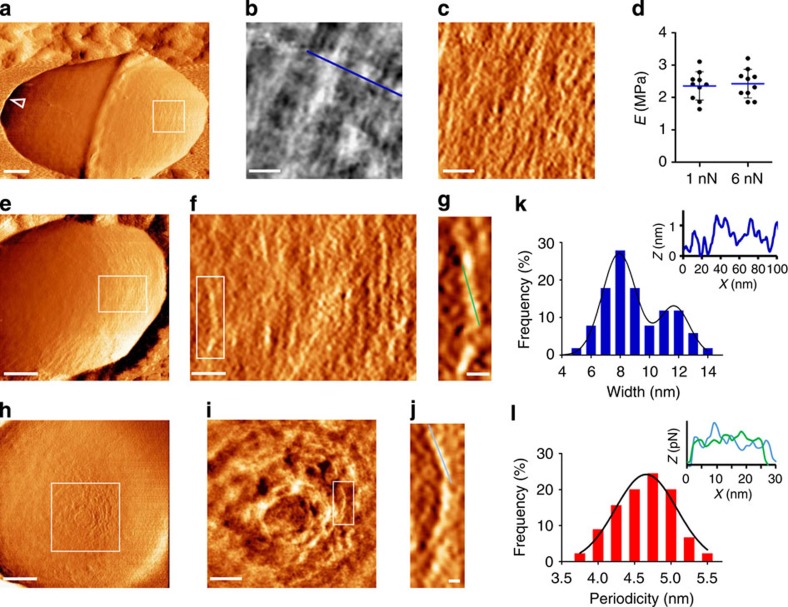
Figure 6. The surface architecture of stationary bacteria.
(a,e,h) Low-magnification force-error images of (a,e) the side wall and (h) pole region (scale bars, 200 nm). (b,i) High-magnification topography images show nanoscale strands aligned in parallel or circling the pole (scale bars, 30 and 75 nm; heights, 1.4 and 2.35 nm, respectively). The strand widths were measured from height profiles (blue line in b,k inset), statistically analysed and is displayed in a histogram k (n=70 strands per cell, from N=8 cells). (c,f) Force-error images show that strands are segmented (scale bar, 30 nm). (d) Cell-wall elasticity, as measured using low and high peak force in PBS (N=10 bacteria from two different cultures, P value>0.05, two-tailed unpaired t-test). (g,j) Single strands from rectangles marked in f,i, respectively (scale bars, 10 nm). The segment periodicity was measured along each strand (corresponding profiles at the same colour are shown in the inset of l), statistically analysed and is displayed in a histogram l (n′=437 segments, n=55 strands from N=8 bacteria).

