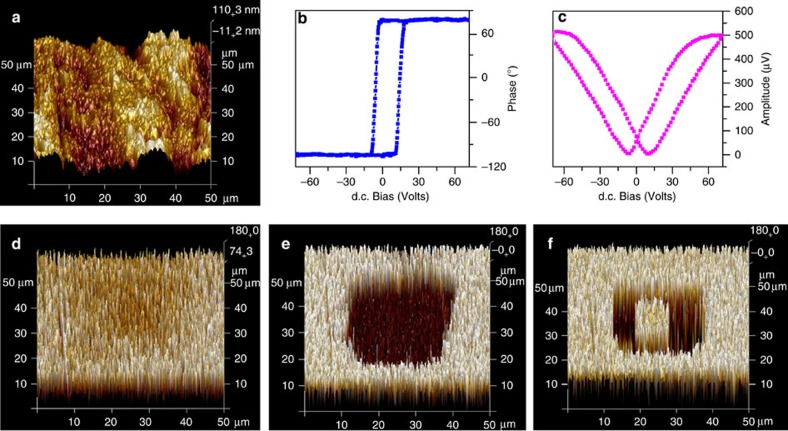
Figure 4. Polarization-switching properties of 1 investigated by piezoresponse force microscopy (PFM) imaging.
(a) Topographic image of the crystal surface of 1. (b,c) Local PFM hysteresis loops measured in the crystal surface ((b) phase signal and (c) amplitude signal). (d) PFM image of the as-grown crystal surface; the white region and pale-yellow region contrast probably indicates the regions with polarization oriented downwards. (e,f) PFM images of a polarization pattern produced by scanning with the tip under ±72 V, respectively (dark-brown region corresponds to downward polarization; white with little yellow region represents upward polarization).

