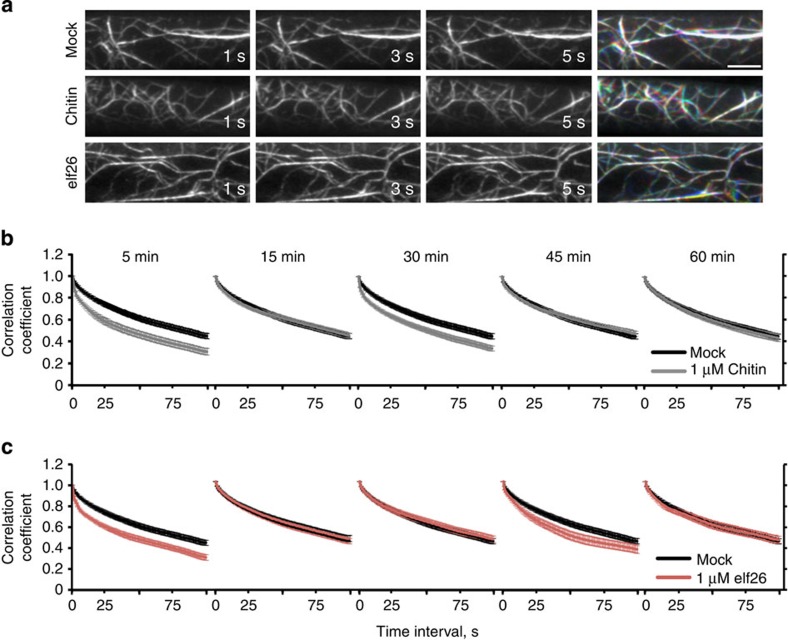
Figure 3. Dynamicity of the cortical actin array is enhanced by MAMPs.
(a) Time-lapse VAEM images from hypocotyl epidermal cells following mock, 1 μM elf26 and 1 μM chitin treatments for 5 min are shown. Three images separated by 2 s were coloured red, green and blue, respectively, and the three images merged in the right column. A white colour indicates actin structures that remain relatively stationary during this time period. Scale bar, 10 μm. (b,c) A correlation coefficient analysis was performed on time-lapse VAEM series from WT epidermal cells treated with mock, 1 μM chitin (b) or 1 μM elf26 (c) for 5, 15, 30, 45 and 60 min. The extent of actin rearrangements during a given time period, or overall dynamicity of the actin array, was determined by decay in correlation as the temporal interval increased. Lower correlation values correspond with higher dynamicity of the actin array. When compared with mock control, the actin array dynamics were significantly enhanced in cells treated with chitin for 5 or 30 min (b); P<0.0001; analysis of variance (ANOVA). However, the dynamicity remained similar to mock control following treatments with chitin for 15, 45 or 60 min (b); P>0.05; ANOVA. Cells treated with elf26 for 5 or 45 min showed significantly enhanced dynamicity compared to mock controls (c); P<0.0001; ANOVA. No significant differences in actin array dynamicity between mock controls and elf26 treatments were observed at the 15, 30 and 60 min time points (c); P>0.05; ANOVA. Analyses were performed on >40 time-lapse series taken from 10 hypocotyls for each treatment per time point. Error bars represent s.e.m.

