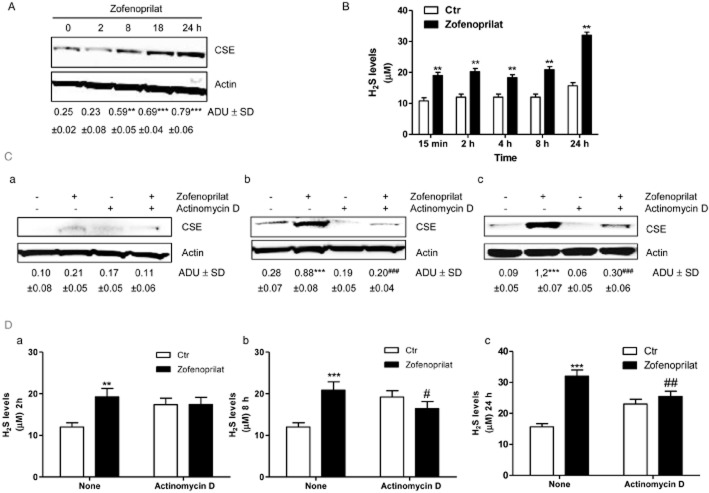
Figure 2.
Zofenoprilat increases CSE protein expression and H2S production. Expression of CSE (A) in HUVECs in control condition and after incubation with zofenoprilat (10 μM) for the indicated times. The blot is representative of three with similar results. The ratio between CSE and actin is presented below the blot. **P < 0.01, ***P < 0.001 compared with untreated cells. Production of H2S (B) was determined in control ECs and in response to zofenoprilat (10 μM) stimulation for 15 min, 2, 4, 8 and 24 h. n = 3. **P < 0.01 versus untreated cells. (C) Expression of CSE in HUVECs in control (Ctr) condition and in response to zofenoprilat (10 μM) in the presence and absence of actinomycin D (5 μg·mL−1) for 2 (a), 4 (b) and 18 (c) h. The blot is representative of three with similar results. The ratio between CSE and actin is presented below the blot. ***P < 0.001 compared with untreated cells. ###P < 0.01 versus zofenoprilat-treated cells. (D) Production of H2S was determined in response to zofenoprilat stimulation (10 μM) in the presence and absence of actinomycin D (5 μg·mL−1) for 2 (a), 8 (b) and 24 (c) h. n = 3. **P < 0.01, ***P < 0.001 versus untreated cells; #P < 0.05, ##P < 0.01 versus zofenoprilat-treated cells.

