
Figure 1.
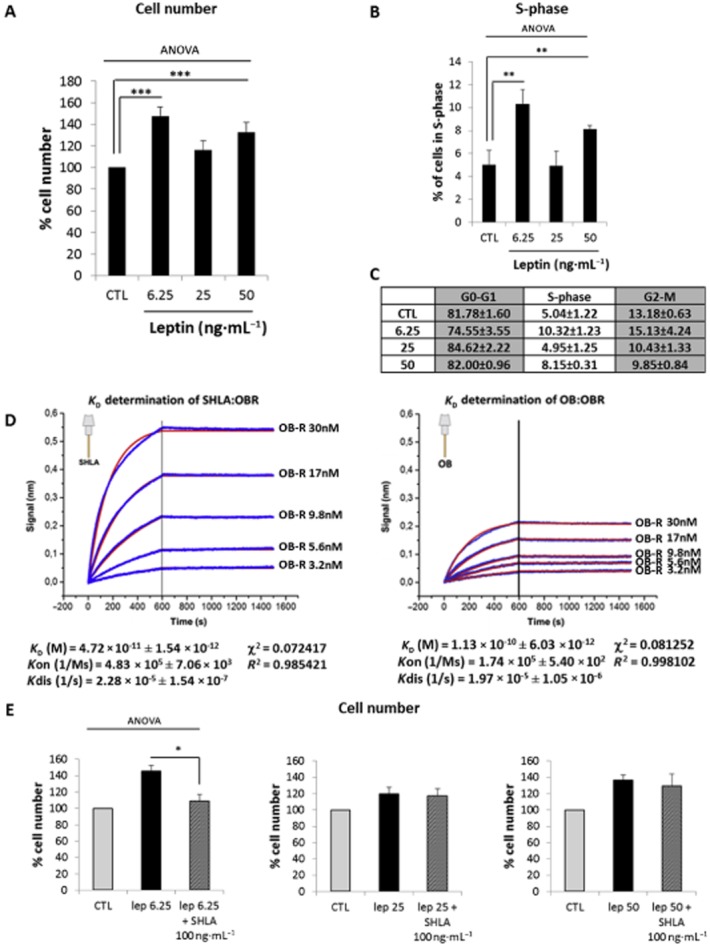
Leptin induces human myometrial smooth muscle cells (HM-SMC) proliferation. Cells were treated with leptin (6.25, 25 and 50 ng·mL−1) for 24 or 12 h (for cell number and S-phase, respectively), labelled with propidium iodide and analysed by flow cytometry. (A, B and C): Proliferation: cell number as a percentage of non-stimulated cells (CTL) (A) and percentage of cells in S-phase versus CTL (B) are presented as mean values ± SEM for five independent experiments. Percentage of cells in each phase of the cell cycle is expressed as mean values ± SEM for five independent experiments in (C). **P < 0.01 versus CTL, ***P < 0.001 versus CTL. (D) Determination of KD for SHLA : leptin receptor (OBR) and leptin (OB) : leptin receptor (OBR). Octet biosensors were saturated with 2 μg·mL−1 SHLA or leptin (OB) and incubated for 10 min with the leptin receptor (3.2, 5.6, 9.8, 17 and 30 nM) for association measurement and 15 min in PBS for dissociation measurement. Results are expressed as delayed wavelength versus time for the variable concentrations (blue curves). Fitting curves (red), KD (equilibrium binding constant), Kon (association rate constant), Kdis (dissociation rate constant), χ2 (chi-squared statistical test) and R2 (correlation coefficient) were determined in global 1:1 model. (E) Effect of leptin receptor antagonist, SHLA. Cells were treated with leptin (6.25, 25 and 50 ng·mL−1) for 24 h in the presence or absence of leptin antagonist SHLA (100 ng·mL−1). Cell numbers are expressed as percentage versus CTL and presented as mean values ± SEM from four independent experiments. *P < 0.05 versus leptin 6.25 alone.