
Figure 5.
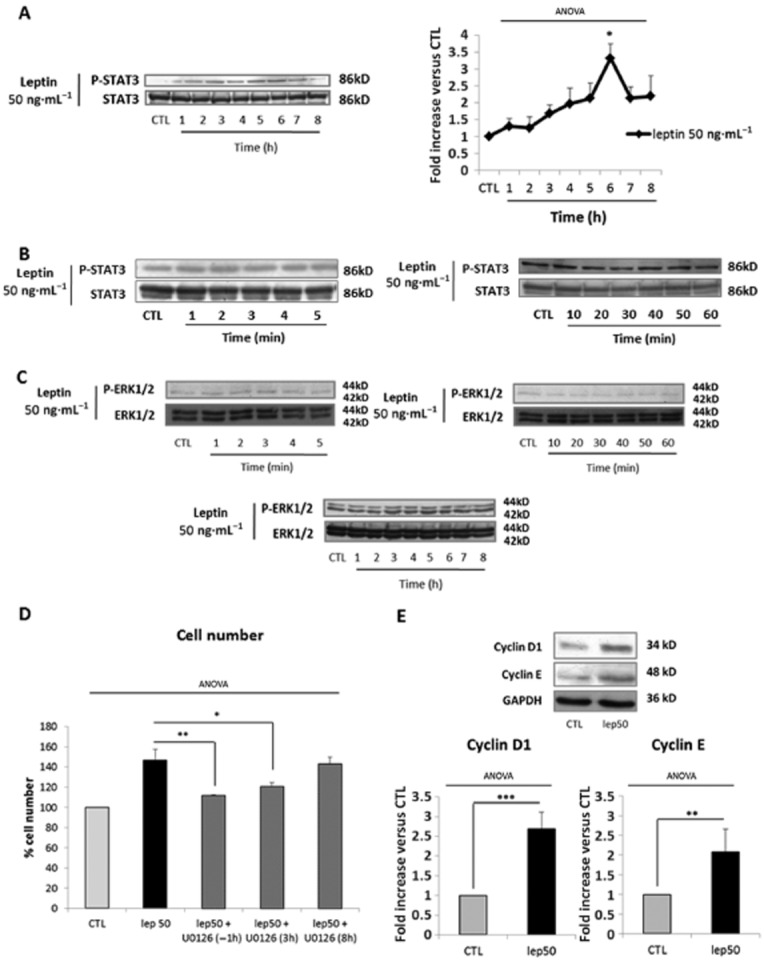
Leptin-induced myometrial cell proliferation at 50 ng·mL−1 is mediated through STAT3 activation. (A and B) Western blots p-STAT3. Cells were cultured with leptin 50 ng·mL−1 for 1–8 h (A) and 1–60 min (B). The blots are representative of four independent experiments. Quantification: 86 kDa p-STAT3 bands were digitized and quantified with QuantityOne. Phosphorylated bands are compared with total of bands formed for each condition and presented as mean values ± SEM. *P < 0.05 versus CTL (non-stimulated cells). (C) Western blots of p-ERK1/2. Cells were cultured with leptin at 50 ng·mL−1 for 0–5 min, 10–60 min and 1–8 h. The blots are representative of five independent experiments. Quantification: 42 kDa p-ERK1/2 bands were digitized and quantified with QuantityOne. Phosphorylated bands are compared with total of bands formed for each condition and presented as mean values ± SEM. (D) ERK1/2 inhibition. Cells were treated with leptin at 50 ng·mL−1 for 24 h in the presence or absence of U0126 (10 μM). U0126 was added 1 h before leptin stimulation (H-1), 3 h (H+3) or 8 h (H+8) after leptin treatment. Numbers are expressed as percentages versus CTL and presented as mean values ± SEM from four independent experiments. *P < 0.05, **P < 0.01 versus leptin 50 alone. (E) Cyclin D1 and cyclin E expression. Cells were stimulated with leptin at 50 ng·mL−1 for 4 h. The blots are representative of four independent experiments. The 34 kDa cyclin D1 and 48 kDa cyclin E bands were digitized and quantified with QuantityOne. Bands are compared with GAPDH for each condition. Relative quantities versus CTL are presented as mean values ± SEM. **P < 0.01 versus CTL, ***P < 0.001 versus CTL.