Figure 1.

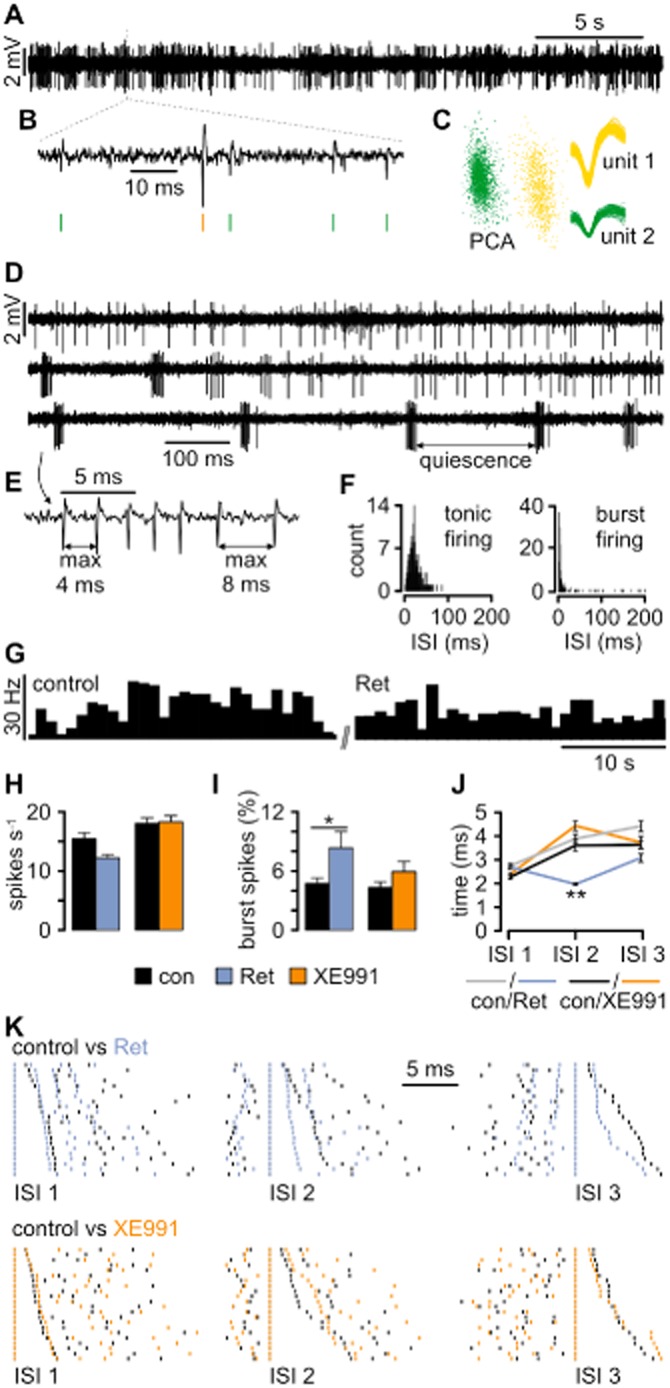
Kv7 channels influence the firing behaviour of TC neurons in vivo. (A) Representative traces recorded in VB revealing spontaneous spiking. (B) The typical waveforms of extracellularly recorded APs are visible on an expanded timescale, thereby allowing spike sorting (green and yellow vertical lines). (C) After spike extraction, waveforms were clustered and sorted into units based on principal component analysis (PCA). (D) Extracellular recording revealing the two distinct TC firing patterns: tonic firing (upper trace) characterized by single APs occurring independently of each other and burst firing (bottom trace) characterized by grouped APs and high-frequency spiking. Bursts are separated by a quiet period of at least 50 ms duration. The two firing patterns can occur concurrently (middle trace). (E) Definition of burst-firing characteristics at higher temporal resolution. (F) Distribution histograms of interspike intervals (ISIs) for tonic and burst firing calculated from adequate activity periods selected manually. Note the narrow peak (reflecting high-frequency firing) and long tail (corresponding to quiescence periods) when the recorded unit is in bursting mode. (G) An example of a firing rate histogram (bin size: 1 s) for a single unit recorded under control conditions and after local Ret injection. (H) Local Ret injection caused a slight, although not significant, decrease in the firing rate, while the injection of XE991 had no effect. (I) Burst analysis revealed that Ret application facilitated burst firing in VB neurons. The application of XE991 caused a smaller and insignificant increase. (J) Analysis of ISI within bursts (intraburst ISI) revealed that Ret application caused a highly significant shortening of the second intraburst ISI (ISI2). (K) Examples of burst ISI distribution during control conditions versus periods after drug application. Each row represents a single burst and every vertical line corresponds to a single AP recorded during the control period (black lines) and after drug injection (coloured lines). To demonstrate the difference between the ISI values, corresponding spikes within each burst were time aligned. The bursts were sorted in length, with the shortest ISI displayed in the first row and the longest in the last row. Ret considerably shortened ISI 2. Data are presented as mean ± SEM. *P < 0.05, **P < 0.01.
