Figure 5.

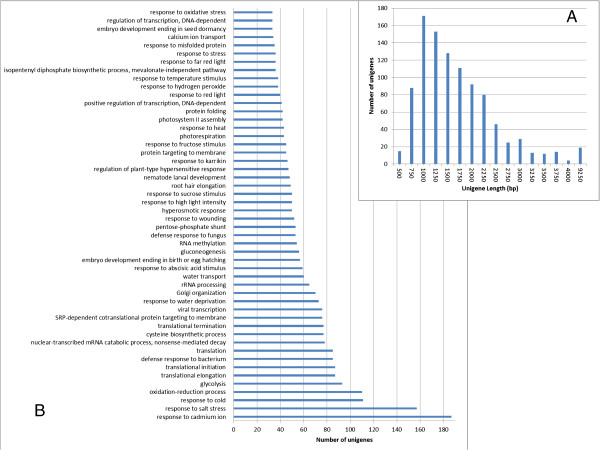
Information of candidate genes in sand rice transcriptome. (A) Histogram showing length distribution of the 1000 most highly expressed unigenes. (B) The 50 highly represented BP GO terms of unigenes were shown.

Information of candidate genes in sand rice transcriptome. (A) Histogram showing length distribution of the 1000 most highly expressed unigenes. (B) The 50 highly represented BP GO terms of unigenes were shown.