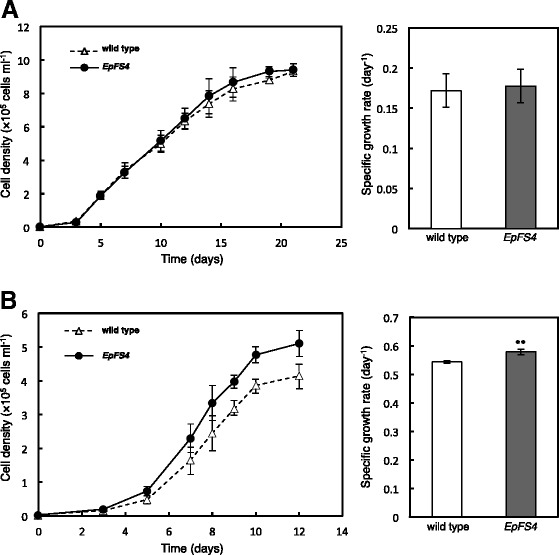
Fig. 2.

Growth curves and growth rates of wild-type and EpFS4 cells grown under different cultivation conditions. Growth curves and growth rates of wild-type and EpFS4 cells grown under normal (100 μmol photons m−2 s−1 at 0.04 % CO2) (a) and high light and high CO2 (350 μmol photons m−2 s−1 at 0.3 % CO2) (b), respectively. Values are indicated as the mean ± standard deviation for three to seven individual experiments. Asterisks indicate significant differences from the wild-type E. gracilis cells (**P < 0.01)
