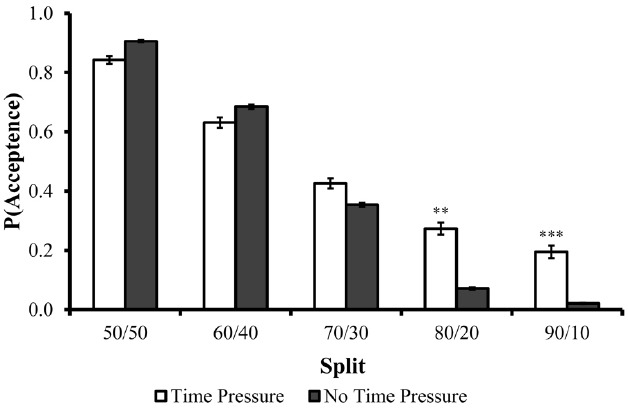
FIGURE 1.

Acceptance rates of each split as a function of the time constraint condition in Experiment 1. Error bars are depicted in black lines. **p < 0.02, ***p < 0.0005.

Acceptance rates of each split as a function of the time constraint condition in Experiment 1. Error bars are depicted in black lines. **p < 0.02, ***p < 0.0005.