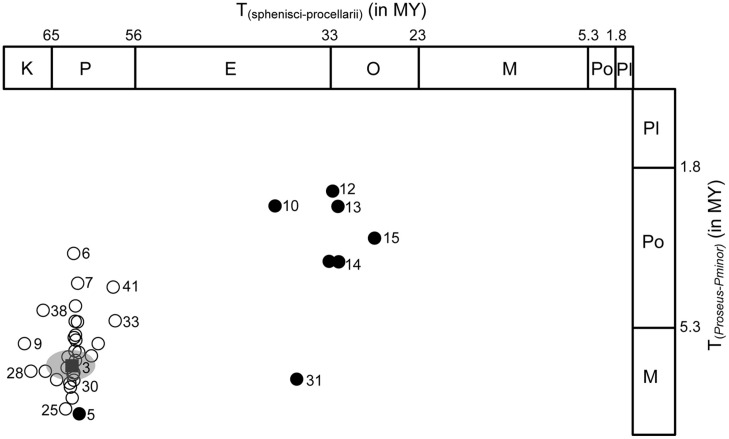
FIGURE 2.
Divergence time scatterplot of a representative young and old aquatic bird node, representing focal clade Phoenicopteridae (Y-axis) and oldest, Sphenisciformes–Procellariiformes, clade (X-axis). Circles show pairwise divergence times from each of 45 sensitivity analyses (see Table 1). Age and 95% CI for reference analysis are indicated by black square and gray circle. Closed circles show divergence time results from analysis using youngest constraints only. Numbers next to circle designate analyses listed in Table 1.

