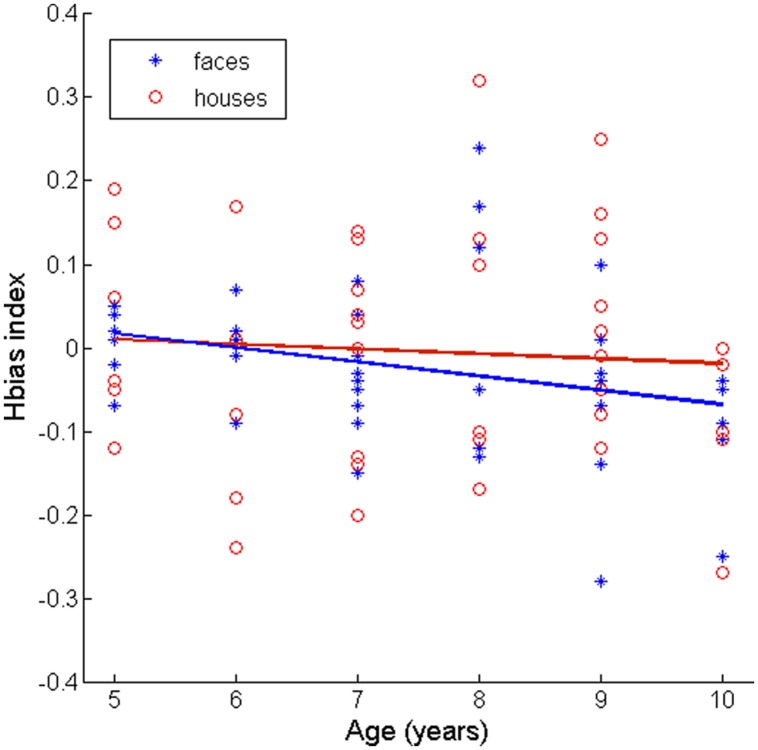
FIGURE 3.
Scatterplots depicting the value of the Horizontal bias index described in the text and age (binned here by years of age) for face and house targets. The overlaid lines depict the least-squares fit of each age vs. bias index relationship. We note that some values within age bins may be very close to one another and thus be difficult to see as separate in this plot.

