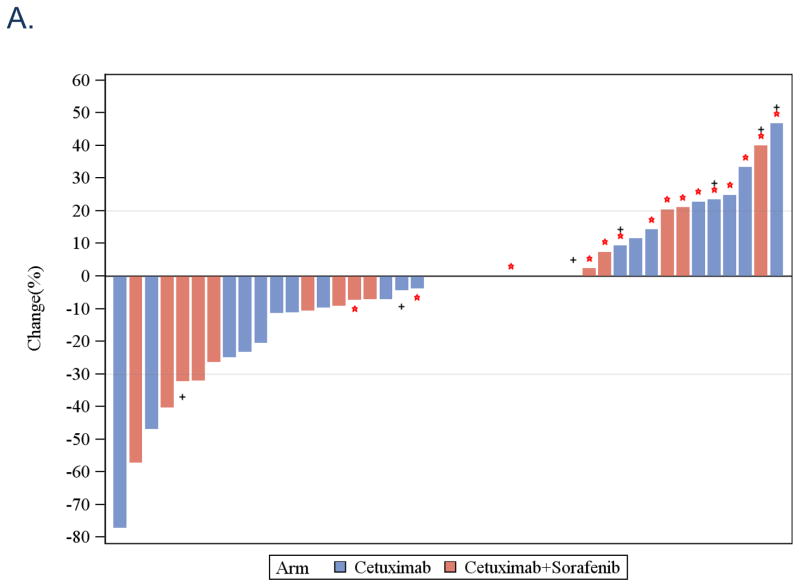
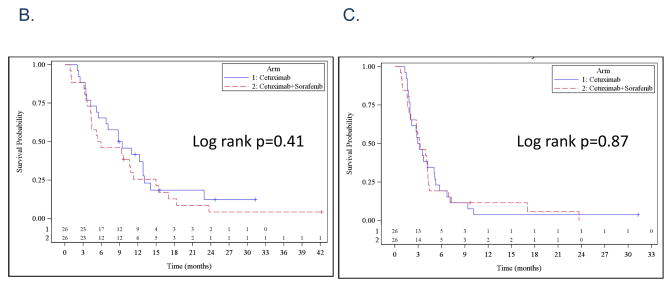
Figure 1.
A. Waterfall plots of response rates after cetuximab (Arm A, blue bar) and cetuximab+sorafenib (Arm B, red bar). Red star *: progressive disease, Black +: p16 immunohistochemical staining positive. B. Overall survival: Kaplan-Meier plot comparing cetuximab (Arm A, blue line) and cetuximab+sorafenib (Arm B, red line). C. Progression-free survival: Kaplan-Meier plot comparing cetuximab (Arm A, blue line) and cetuximab+sorafenib (Arm B, red line).


