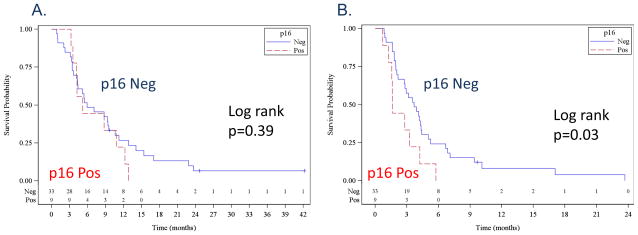
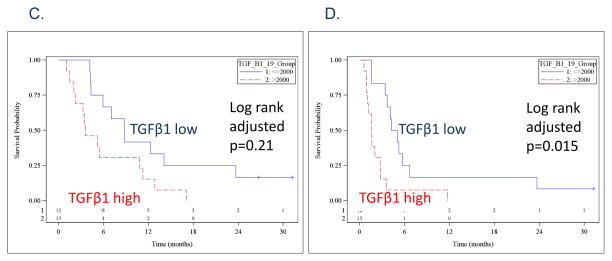
Figure 2.
Kaplan-Meier plots comparing p16-negative patients (blue line) and p16-positive patients (red line). A. overall survival, and B. progression-free survival. Kaplan-Meier plots comparing patients with plasma TGFβ1 levels lower than the median (blue line) and higher than the median (red line). C. overall survival, and D. progression-free survival.


