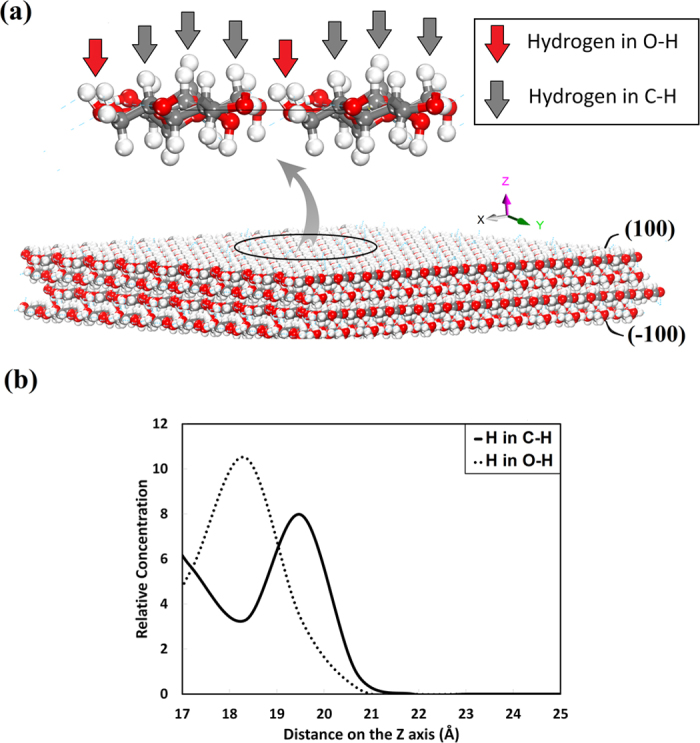
Figure 5.

a) Distribution of hydrogen atoms on the (100) and ( ) surface. These surfaces are covered with hydrogen atoms that are bonded either to oxygen or carbon. The hydrogen atoms that are connected to oxygen are less exposed than the hydrogen atoms connected to carbon because they stay closer to the surface. b) The relative concentration of hydrogen in O−H and C−H along Z axis. Hydrogen in O−H groups accumulates at 18.3 Å, while the hydrogen in C−H groups accumulates at 19.8 Å.
