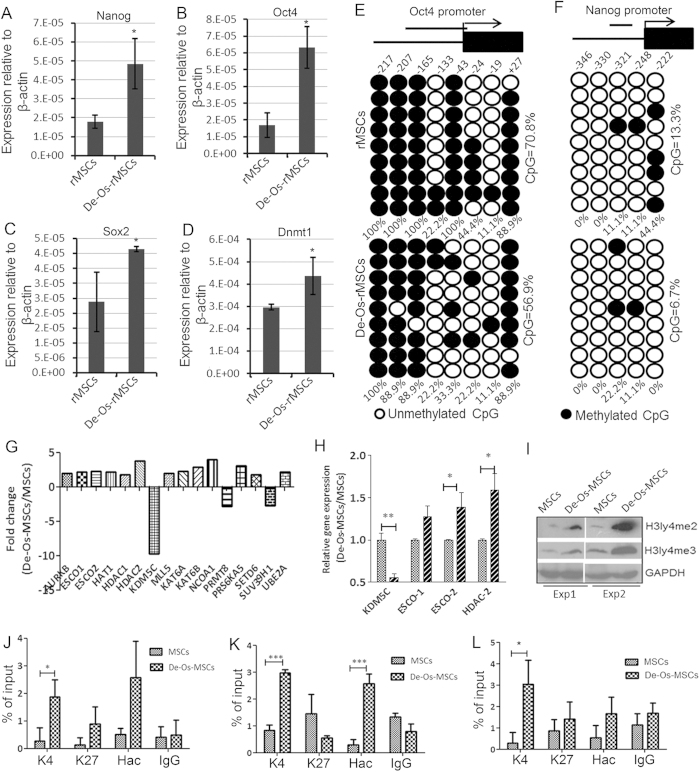
Figure 5. Epigenetic regulation of Nanog and Oct4 in De-Os-rMSCs.
(A-D) Total RNA were extracted from rMSCs and De-Os-rMSCs. The relative expression levels of Oct4, Nanog, Sox2 and Dnmt1 were checked by qRT-PCR. β-actin was used as an internal control. The data are expressed as mean ± SD (n = 3). *p < 0.05. (E-F) DNA methylation status of Oct4 and Nanog promoters in rMSCs and De-Os-rMSCs using sodium bisulfite sequencing. The top panel indicates the CpG dinucleotide position of the Oct4 and Nanog promoter regions and the numbers show positions of CpGs relative to the translation start site. Each PCR product was subcloned and subjected to nucleotide sequencing analysis. Nine representative sequenced clones were depicted by filled (methylated) and open (unmethylated) circles for each CpG site. (G-L) Chromatin configurations in De-Os-rMSCs compared to rMSCs. (G) Differentially expressed histone modifying enzymes in De-Os-MSCs and MSCs examined by focused PCR array. (H) QRT-PCR analysis confirmed the differentially expressed histone modifying enzymes as identified in (G). (I) Western blot analysis showing the expression of H3K4me3 and H3K4me2 were increased in De-Os-MSCs compared to MSCs. The data showing here are two independent experiments. (J-L) Increased occupany of H3K4me3 and H4ac on Oct4 (primer1 and primer 2 as detailed in Supplementary Table 2) and Nanog promoters. The histone modifications of Oct4 (J&K) and Nanog (L) promoters were analyzed by CHIP-PCR assay. CHIP was done using anti-H3K4me3, anit-H3K27 and anti-H4ac monoclonal antibodies, and PCR was performed with primers listed in supplementary table. Normal rabbit IgG was used as a negative control. Values are expressed as mean ± SD of three independent experiments. *p < 0.05.

