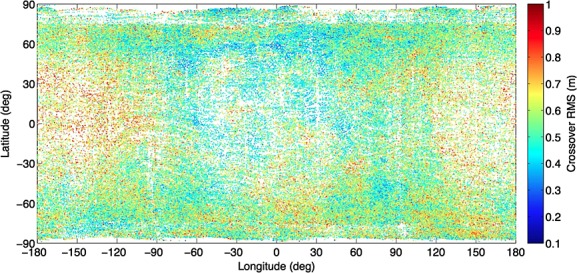
Figure 1.

Spatial distribution of the selected LOLA crossovers. Color indicates the radial residual root-mean-square (RMS) of fit after crossover adjustment (section 2.3.3) and is correlated with surface roughness. Only half of the crossovers are shown for clarity.
