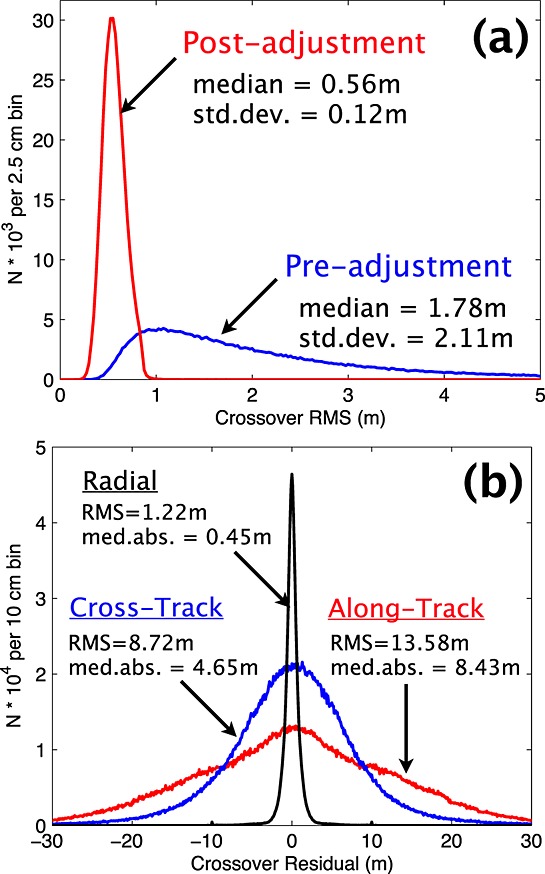
Figure 2.

(a) Distribution of RMS radial residuals before (blue) and after (red) adjustments. (b) Distribution of radial (black), cross-track (blue), and along-track (red) offsets. For clarity, the counts for the cross-track and along-track distributions are multiplied by 5.
