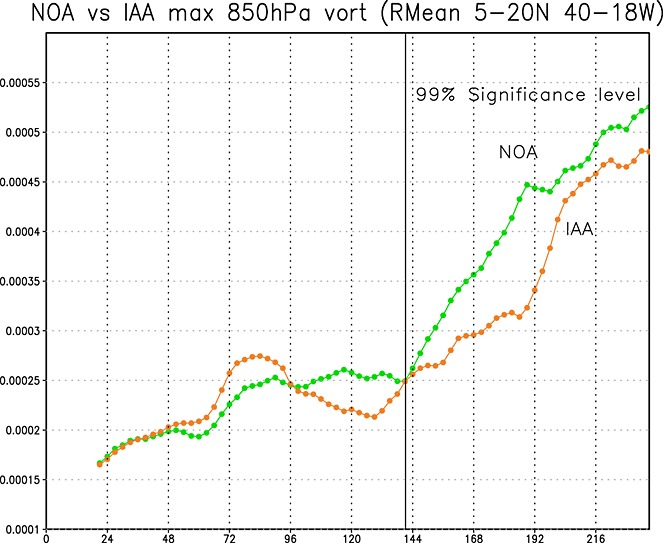
Figure 2.

Running 24 h mean, as a function of forecasting time, for eight NOA and eight IAA forecasts of 850 hPa maximum vorticity. The vorticity maxima are detected at each time step over a chosen domain (5°N–20°N, 40°W–18°W) shown in Figure 1(bottom right), which is affected by a strong dust outbreak. The eight forecasts are initialized from 21 UTC 19 August to 21 UTC 27 August. After day 6, the difference IAA minus NOA is statistically significant at 99%.
