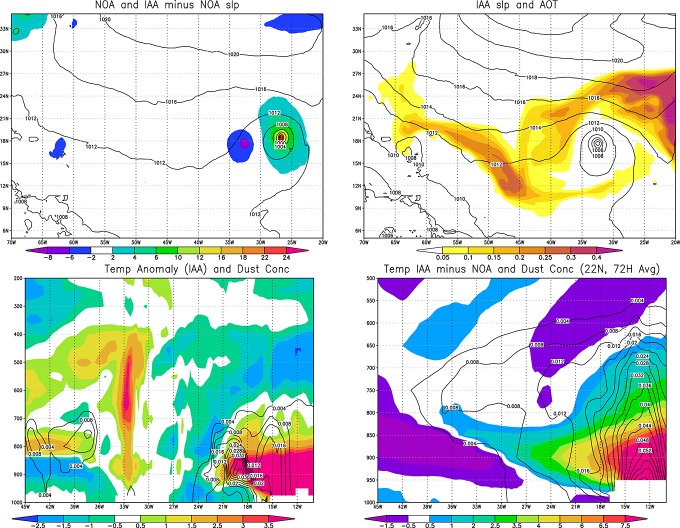
Figure 3.
(top) Ten-day forecast initialized at 21z 26 August 2006 of NOA slp (hPa, solid, left) and IAA minus NOA slp departure (shaded, left), and IAA slp (solid, right) and AOD (shaded, right). (bottom, left) Dust concentration and IAA temperature anomaly (°C), obtained by subtracting the mean IAA temperature from 80°W to 20°W at 18°N. (bottom, right) Forecast from day 7 to 10, 72 h average, of IAA minus NOA temperature (shaded) and corresponding mean dust concentration, at 22°N.

