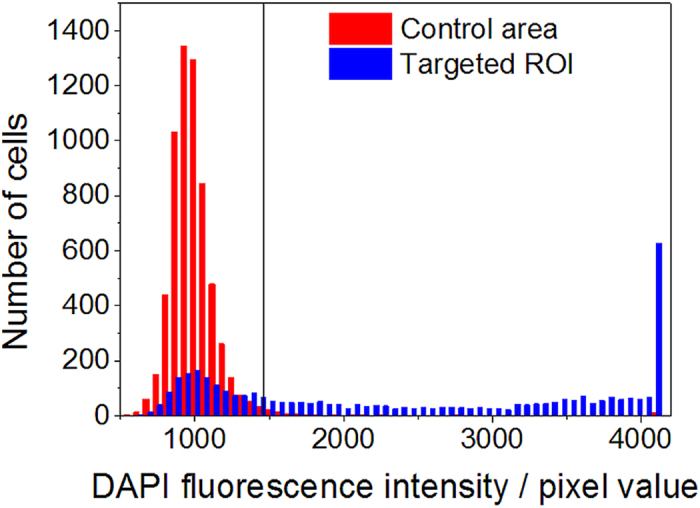
Figure 7. Histograms of DAPI fluorescence intensities for laser illuminated (targeted) and control (not illuminated) cells.

The vertical line indicates the threshold above which cells were counted as “optoporated”. The threshold is the average fluorescence value of the set of control cells plus two standard deviations determined from fitting a Gaussian to the intensity distribution.
