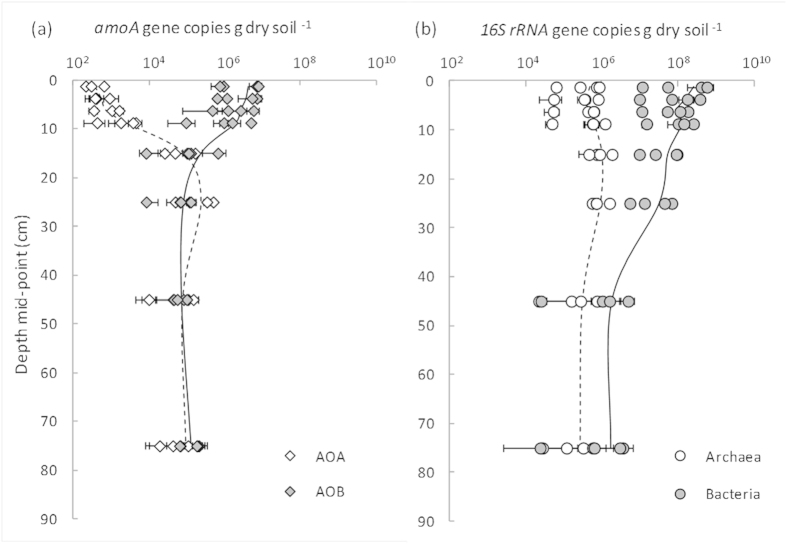
Figure 1.
Abundance of bacterial and archaeal amoA genes (a) and bacterial and archaeal 16S rRNA genes (b) in Western Australian semi-arid agricultural soils. Data points represent means of three soil cores (per soil layer) collected from trial sites where soil pH (−lime versus +lime) or soil organic matter (−OM versus +OM) had been historically altered. Error bars represent ± 1 SE. The mean of all treatments combined at each depth are shown by the dashed line (archaea) or solid line (bacteria). Note: gene copy numbers are plotted on a log10 scale.

