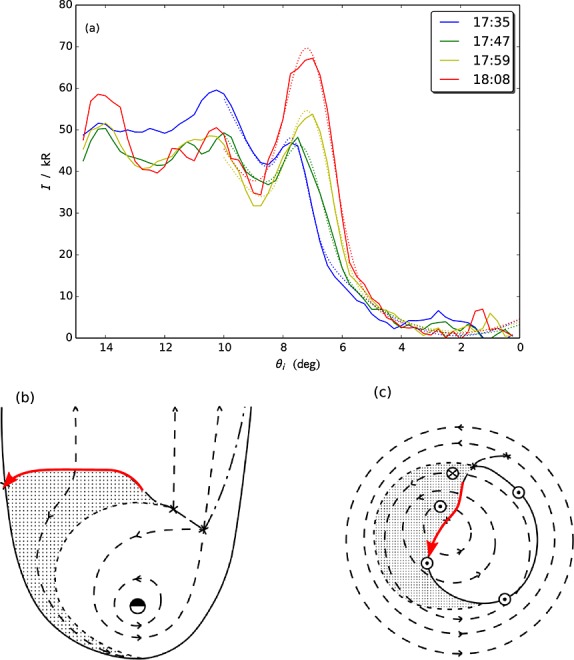
Figure 2.

(a) The intensity averaged over five exposures and longitudes 230°–260°, versus colatitude. The legend indicates the light travel-corrected start times of the first image associated with each colored line. The colored dotted lines show the associated Gaussian fits to the peaks at the poleward boundary, as discussed in the text. Figures 2b and 2c show a schematic adapted from Cowley et al. [2005] illustrating (b) the equatorial hot plasma and flow streamlines part way through an interval of rapid solar wind-induced tail reconnection and (c) the ionospheric counterpart. A sketch of the path of the day 95 bursts and their equivalent in the equatorial plane are shown by the superimposed red arrows.
