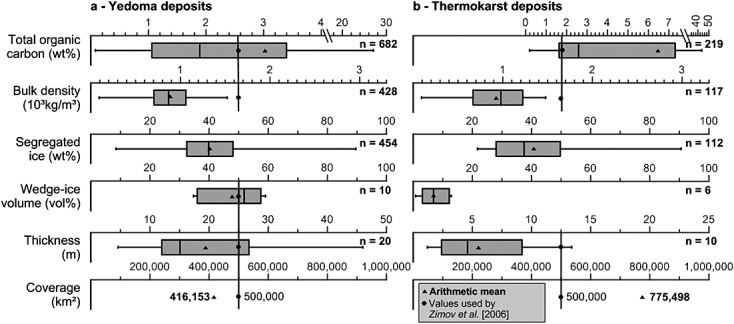
Figure 3.

Box plots of the key parameters for (a) Yedoma and (b) thermokarst deposit organic carbon estimation. The literature estimate [Zimov et al., 2006] is given by the vertical black line for comparison. Note the different axis scale in Figures 3a and 3b for total organic carbon (TOC) and thickness. Tables S2–S5 (SI) contain these parameters with uncertainty estimates.
