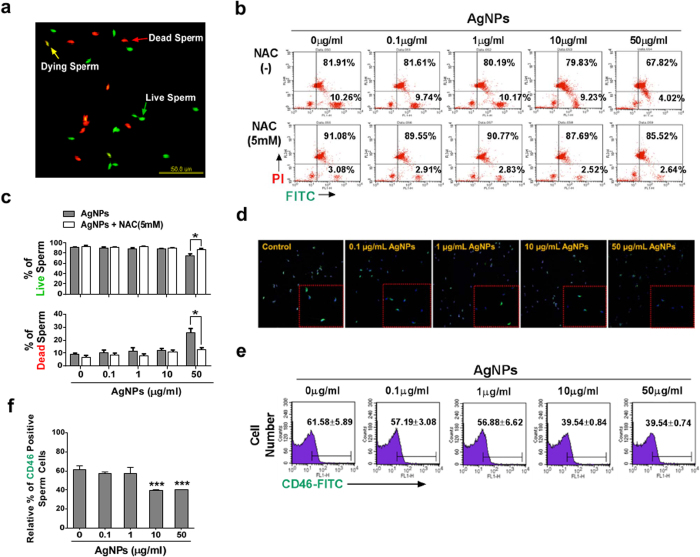
Figure 3. Sperm viability and acrosome reaction analysis.
Sperm cells were treated with 0, 0.1, 1, 10, or 50 μg/mL AgNPs. For the ROS inhibitor group, sperm were pretreated with 5 mM NAC for 30 min, and then, 0–50 μg/mL of AgNPs was added. Dead and live sperm cells were counted using the Dead/Live kit. (a) Fluorescence microscopy image. Live sperms cells were stained with SYBR 14 dye (green fluorescence), whereas dead sperm cells were stained with propidium iodide (PI; red fluorescence). Yellow color in the merged image indicates dying sperm cells. (b & c) Dead and live sperm cells were calculated by flow cytometry: FL1 and FL2 represent green (live sperm) and red (dead sperm) color. (d) A representative immunofluorescence staining pattern obtained using mouse anti-CD46 (green) antibody. Nuclei are counterstained with DAPI (blue). (e & f) Flow cytometry analysis of CD46-positive sperm populations. Data for (f) was obtained from the flow cytometry experiment in (e). *p < 0.05, **p < 0.01, and ***p < 0.001 versus the control group (Dunnett’s t-tests).

