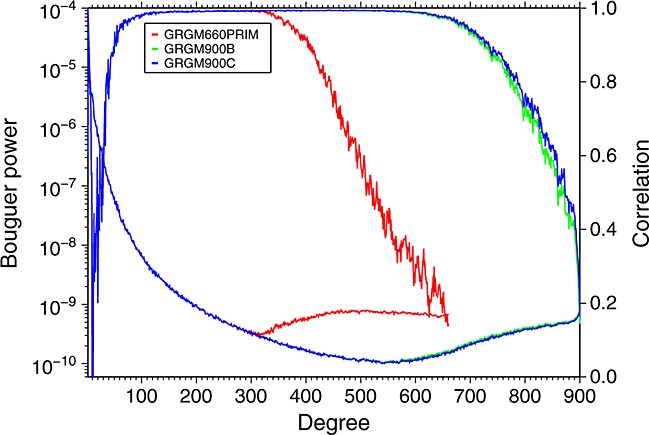
Figure 2.

Correlations between gravity solutions and gravity computed from LOLA topography, and Bouguer power spectrum. The top curves (referred to the right axis) show global correlations for the Primary Mission model, GRGM660PRIM, and the models including Extended Mission data, GRGM900B and GRGM900C. The bottom curves (referred to the left axis) show the spectrum of the Bouguer power for the three gravity models.
