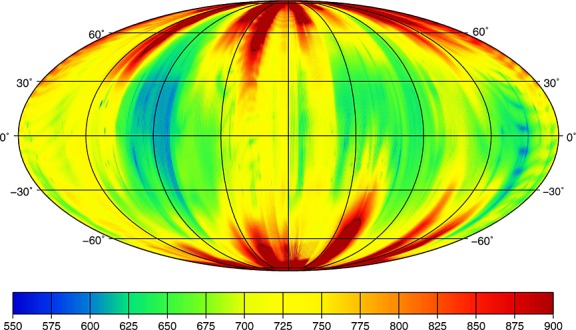
Figure 5.

Degree strength of the GRGM900C gravity model. The map shows spatially at what degree the gravity field errors match the expected signal power from the applied Kaula power law. The map is a Mollweide projection centered on 270°E, with the lunar farside to the left of the figure center, and the lunar nearside to the right of the figure center.
