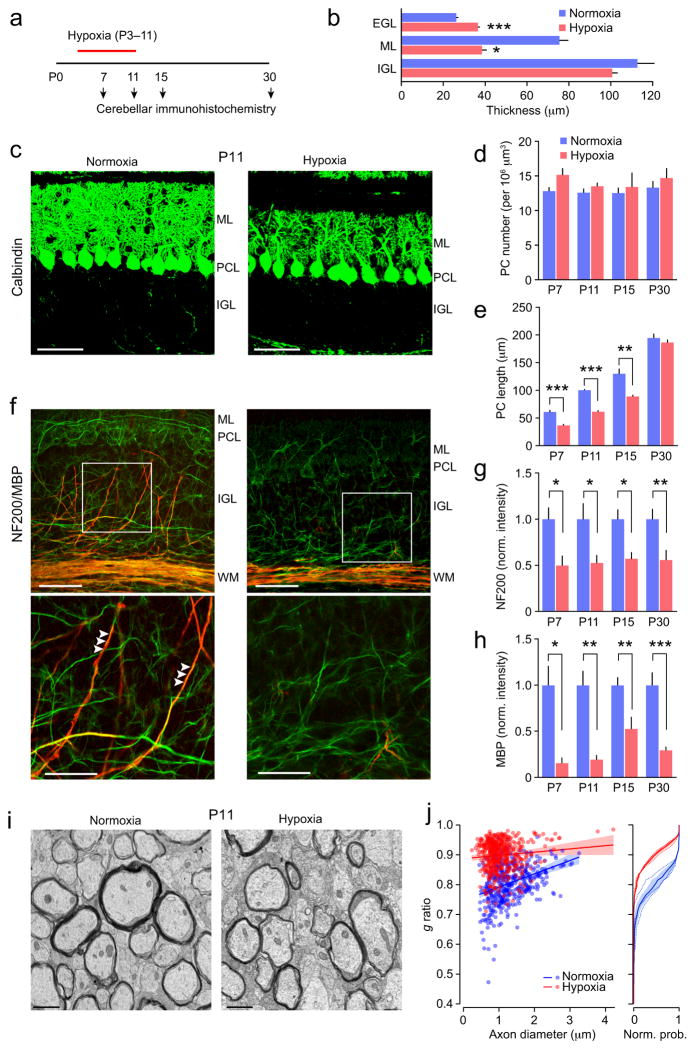
Figure 1. Changes in cerebellar myelination following neonatal hypoxia.
(a) Timeline showing the experimental design. (b) Effect of hypoxia on thickness of cortical layers at P11. Note the lack of change in internal granule cell layer (IGL; n = 4 mice each), but reduced thickness of the molecular layer (ML; n = 6 and 5 mice) and increased thickness of the external granule cell layer (EGL; n = 6 and 5 mice). For all panels bar graphs are presented as mean ± s.e.m. * P < 0.05, ** P < 0.01, *** P < 0.001 (unpaired Welch two-sample t tests). (c) Representative confocal images of sagittal sections from P11 mice showing calbindin immunofluorescence (green). ML, molecular layer; PCL, Purkinje cell layer; IGL, internal granule cell layer. Scale bars 50 μm. (d) Effects of hypoxic treatment on Purkinje cell (PC) number. Two-way ANOVA showed a significant main effect of treatment but no effect of age and no interaction between age and treatment (n = 4–7 normoxic mice and 4–7 hypoxic mice). There was no effect of hypoxia on Purkinje cell number at any age. (e) Hypoxic treatment decreased Purkinje cell length at P7-P15. Two-way ANOVA showed significant main effects of hypoxia and age and a significant interaction (n = 4–7 normoxic mice and 5 hypoxic mice at each age). (f) Representative confocal images showing NF200 (green) and MBP (red) immunofluorescence. Abbreviations are as in c, plus WM, white matter. Scale bars 50 μm. Boxed areas are shown enlarged in lower row. Scale bars 25 μm. Arrowheads indicate myelination of presumptive Purkinje cell axons. Note the reduced myelination of these axons following hypoxia. (g) Hypoxic treatment decreased NF200 immunofluorescence in white matter. Two-way ANOVA showed a significant effect of hypoxia, no significant effect of age and no interaction (n = 6–10 normoxic mice and 5–12 hypoxic mice). (h) Hypoxic treatment decreased MBP immunofluorescence in white matter. Two-way ANOVA showed significant effects of hypoxia, no effect of age and no interaction (n = 5–10 normoxic mice and 4–9 hypoxic mice). (i) Electron microscopy images from P11 white matter. Scale bars 1 μm. (j) Left, scatter plot of g ratios of individual axons versus axon diameter; pooled data from three normoxic and three hypoxic mice (blue and red, respectively). Fitted lines are linear regressions and shaded areas indicate 95% confidence bands. Right, plot of normalized cumulative probability of g ratio for the 3 normoxic mice (blue dashed lines) and the three hypoxic mice (red dashed lines). Solid lines are the averaged probability plots and the shaded areas denote the s.e.m. Hypoxia increased the g ratio from 0.81 ± 0.02 to 0.91 ± 0.004. See Supplementary Methods Checklist for full details of statistical tests.

