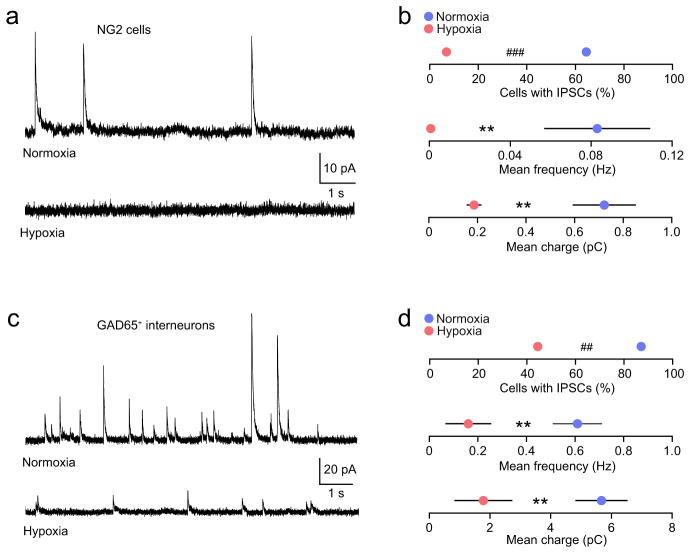
Figure 4. Reduced GABAergic synaptic activity in cerebellar white matter NG2-cells and GABAergic interneurons following neonatal hypoxia.
(a) Representative whole-cell current recordings from cerebellar white matter NG2-cells (+30 mV) in slices from a control NG2DsRed mouse (upper trace, P8) and from a mouse following hypoxic treatment (lower trace, P7). (b) Pooled data showing reduced IPSC prevalence (20/31 cells from 13 normoxic mice and 2/29 cells from 9 hypoxic mice; ### P < 0.001, Fisher’s exact test), reduced IPSC frequency and reduced IPSC-mediated charge transfer following hypoxia (** P < 0.01; unpaired Welch two sample t tests). (c) Representative whole-cell current recordings from cerebellar white matter GAD65+ neurons (+30 mV) in slices from a control mouse (upper trace, P8) and from a mouse following hypoxic treatment (lower trace, P9). (d) Pooled data showing reduced IPSC prevalence (27/31 cells from 10 normoxic mice and 8/18 cells from 7 hypoxic mice; ## P < 0.01, Fisher’s exact test), reduced IPSC frequency and reduced IPSC-mediated charge transfer following hypoxia (** P < 0.01; unpaired Welch two sample t tests). Frequency and charge data shown as mean ± s.e.m. See Supplementary Methods Checklist for full details of statistical tests.

