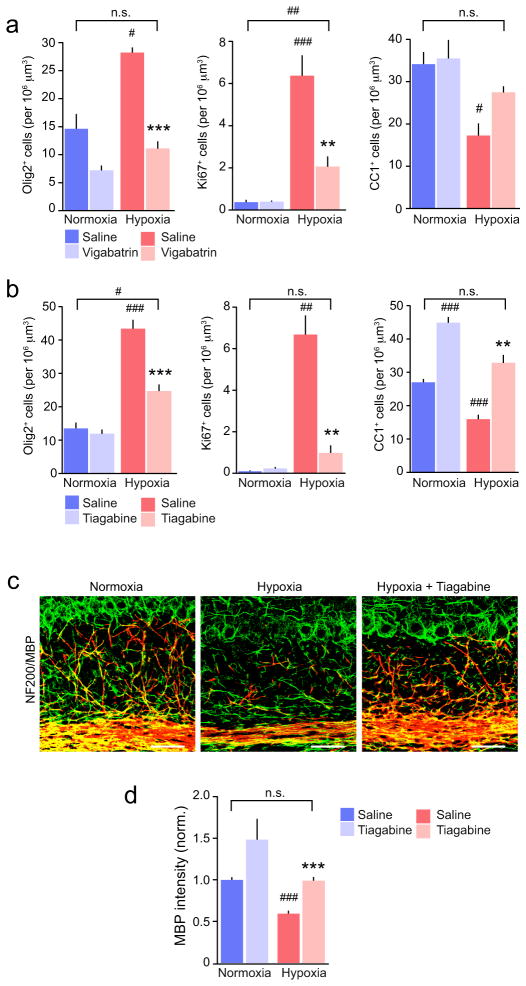
Figure 7. Effects of tiagabine and vigabatrin on NG2-cell proliferation and loss of mature oligodendrocytes following hypoxia.
(a) Pooled data showing the effects of vigabatrin (n = 4–10 mice) on the numbers of Olig2+, Ki67+ and CC1+ cells. Details of animal numbers and results of two-way ANOVA are presented in Supplementary Methods Checklist (see Supplementary Fig. 8 for representative images). (b) Same as shown in a, but for tiagabine (n = 4–7 mice). Asterisks denote the significance of differences between saline and drug in hypoxic mice (* P < 0.05, ** P < 0.01, *** P < 0.001), and hash symbols denote the significance of differences between all conditions and normoxic saline-injected controls (# P < 0.05, ## P < 0.01, ### P < 0.001; Welch two sample unpaired t test with Holm’s sequential Bonferroni correction for repeated tests; for details see Supplementary Methods Checklist). (c) Representative confocal images showing NF200 (green) and MBP (red) in cerebellar sections from P15 saline-treated normoxic mice and hypoxic mice treated with either with saline or tiagabine. Scale bars 50 μm. (d) Pooled data (n = 5–6 mice) showing that following hypoxia, tiagabine (P11 to P15) promoted recovery of MBP. Asterisks and hash symbols as defined in b; for details see Supplementary Methods Checklist. Graphs are presented as mean ± s.e.m.

