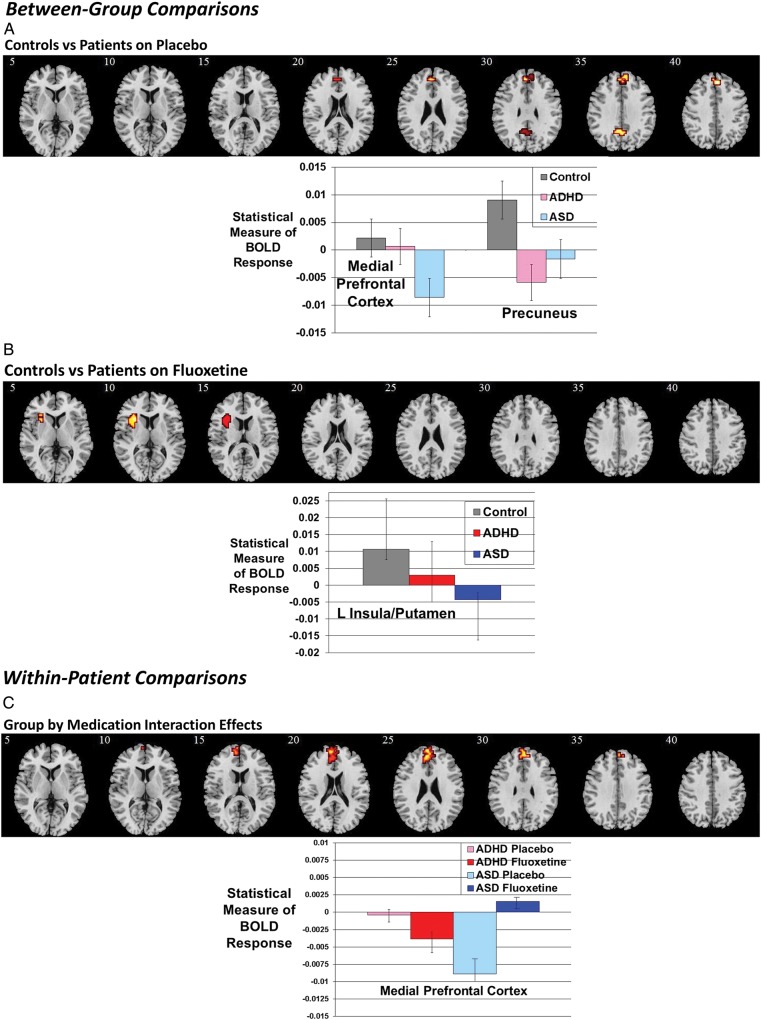
Figure 3.
(A) Between-group and within-patient comparisons: axial sections showing the between-group ANCOVA findings between controls and patients under placebo. Shown underneath are the statistical measures of BOLD response for each of the 3 groups for each of the brain regions that showed a significant group effect. mPFC, medial prefrontal cortex. Error bars indicate standard error. (B) Axial sections for the between-group ANCOVA comparison between controls and patients under Fluoxetine. (C) Axial sections showing within-patient group by medication interaction effects. Talairach z co-ordinates are indicated for slice distance (in mm) from the intercommissural line. The right side of the image corresponds to the right side of the brain.

