Figure 6.
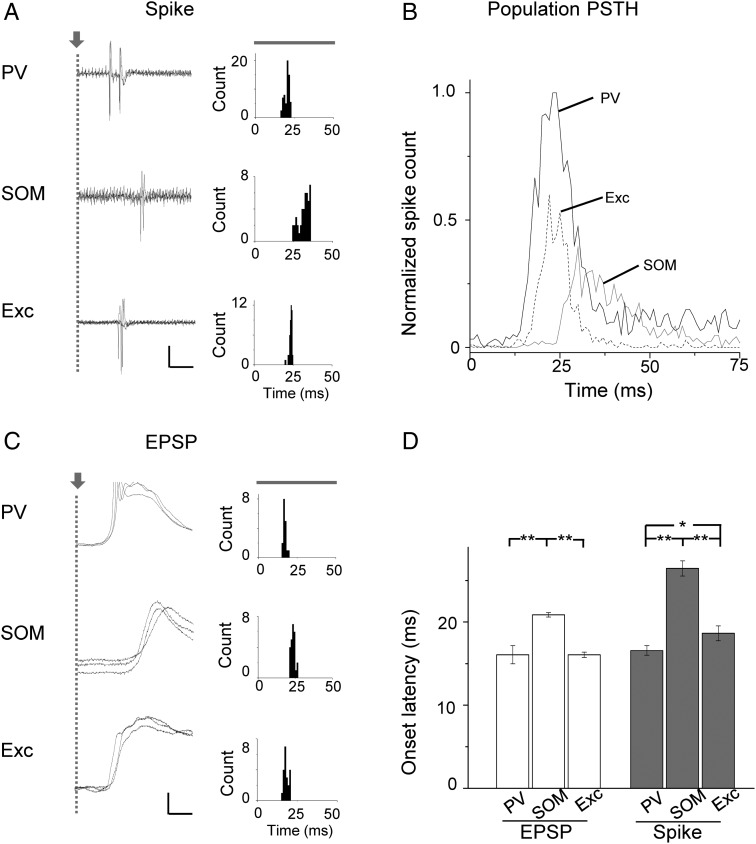
Temporal latencies of spike response and synaptic input. (A) Left, superimposed spike response traces (3 trials) to CF tones at 60 dB SPL for a PV, SOM, and excitatory neuron all preferring 8 kHz. Gray dashed line marks the tone onset. Note that 2 spikes were evoked in the PV cell, while only 1 spike was evoked in the SOM and excitatory neurons. Scale: 0.18 nA (PV), 0.07 nA (SOM), 0.2 nA (Exc), and 10 ms. Right, PSTH generated from the spike responses to CF and near CF (± 0.1 octave) tones at 60 and 50 dB SPL for the cell shown on the left. (B) Population PSTH generated from responses to CF and near CF tones at 60 and 50 dB SPL of all the recorded cells in each group. Bin size = 1 ms. Spike counts were averaged over trials and cell numbers and normalized to the peak value of the PV population. The tone onset is at 0 ms. Cell numbers are the same as in Figure 4A. (C) Left, recorded membrane potential responses (3 trials) for 3 example cells. Spikes are truncated. Scale: 15 mV (PV), 8 mV (SOM), 6 mV (Exc), and 10 ms. Right, distribution of onset latencies of EPSPs evoked by CF and near CF tones at 60 and 50 dB SPL. Note that a sharp peak indicates that the onset latency is relatively precise. (D) Average onset latencies of EPSP (white) and spike (gray) responses to CF tones at 60 dB SPL. Input: PV, 16.08 ± 1.09 ms; SOM, 20.86 ± 0.27; Exc, 16.07 ± 0.32 ms. Spike: PV, 16.59 ± 0.58 ms; SOM, 26.44 ± 0.91 ms; Exc, 18.64 ± 0.88 ms. N (from left to right) = 8, 19, 6; 27, 22, 16. *P < 0.05, **P < 0.01, ANOVA and post hoc test.

