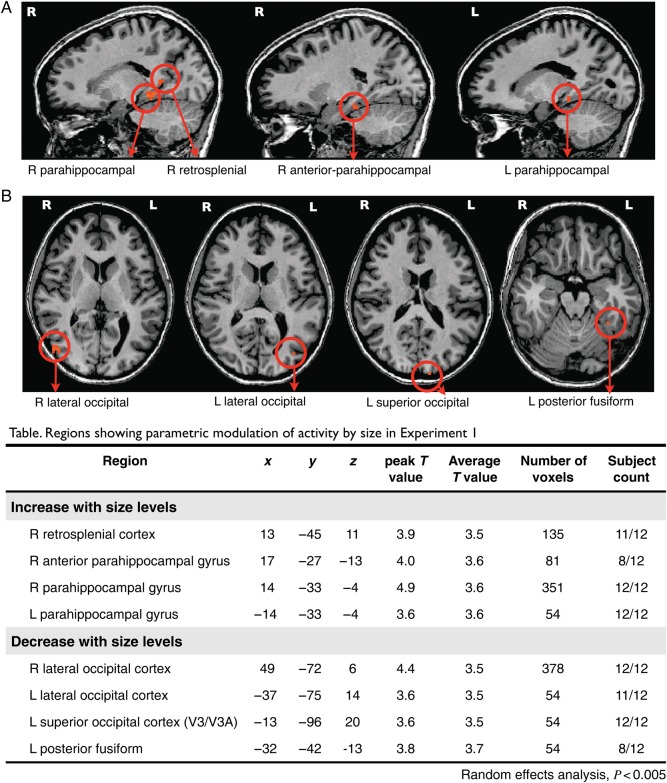
Figure 4.
The figure shows regions from parametric whole-brain analysis (random-effects analysis, P < 0.005, cluster threshold >54 mm3) in Experiment 1. Names of regions are marked with arrows below each figure. (A) Regions showing parametrically higher activity as the size of scenes increase; (B) Regions showing parametrically higher activity as the size of scenes decrease; In the table, names of regions showing parametric modulation of activity with Talairach coordinates for peak voxels within each regions, peak and average T values, number of voxels, and the count of subjects who showed the same regions in individual whole-brain analyses.

