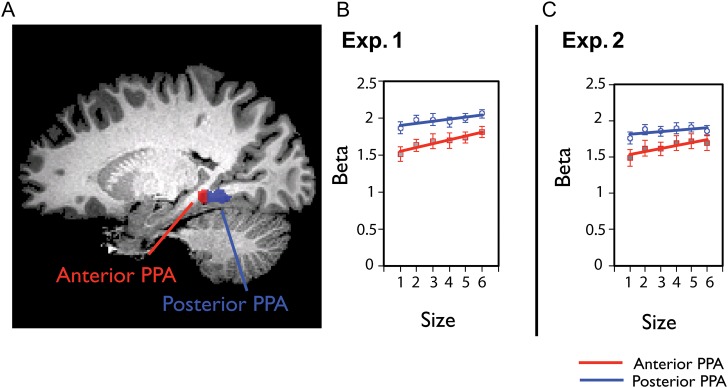
Figure 5.

(A) An example of the anterior and posterior PPA of one representative subject is shown. The anterior and posterior PPA were defined by a split-half analysis within each individual's functionally localized PPA. (B) The average beta weights for the size of space in the anterior and posterior halves of the PPA in Experiment 1. The anterior and posterior halves are indicated by red (anterior) or blue (posterior) lines. The PPA shows greater increase of activity for anterior subdivisions compared with posterior subdivision. (C) The anterior–posterior PPA analysis in Experiment 2 showed the same result. Error bars reflect ±1 standard error of the mean.
