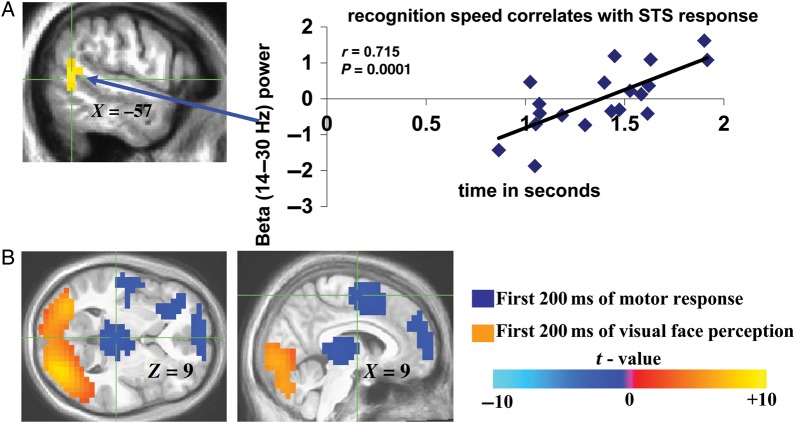
Figure 2.
Perceptual correlates of sustained and transient beta-band activity. (A) Location of correlations between left STS beta-band activity and emotion (fear and happiness) recognition speed assessed post-MEG. Corresponding correlation (Pearson's R) graph between reaction time for fear and happiness recognition and the corresponding extracted left posterior STS beta-band activity values for each individual was included to further illustrate the relationship between the observed left beta-band signals shown to correlate with recognition speed in a whole-brain regression analysis. (B) Visual (orange)- and motor (blue)-related beta-band activity elicited by first 200 ms of viewing facial videos compared with first 200 ms of gender identification-related motor response, respectively. Color bar represents t values in (B) (for (B), negative t values are not inhibitory responses, but rather denote positive t values for motor response-evoked beta-band activity compared with visually evoked beta-band activity).

