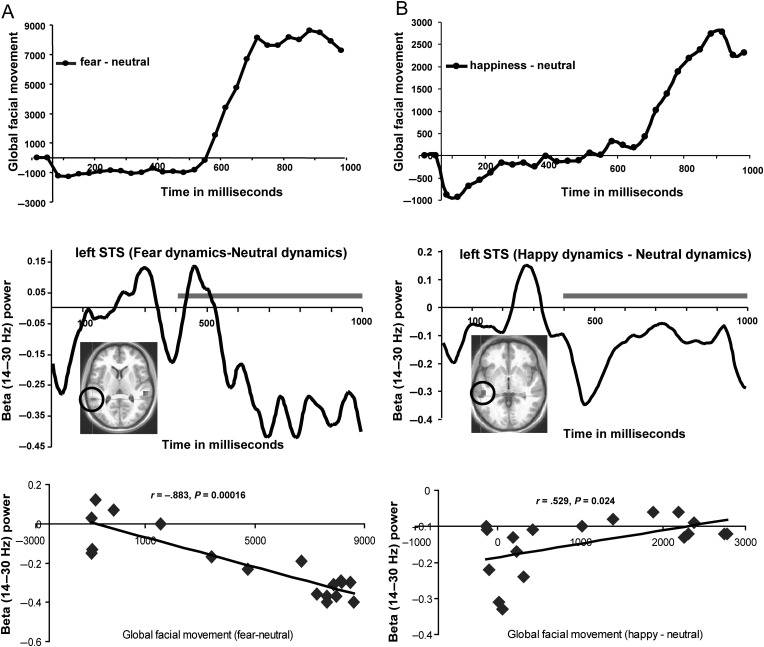
Figure 4.
Time course of STS beta-band activity couples with time course of the emergence of emotional facial dynamics. (A and B) Top depicts the global face movements for fearful and happy expressions, respectively, calculated using the PerceptualDiff image analyzer program; (A and B) Middle depicts the time courses of left STS (encircled ROI) beta-band activity evoked by fearful and happy relative to neutral expressions across the entire 1-s viewing epoch; (A and B) Bottom shows scatter plots illustrating the cross-correlation between the STS beta-band activity time courses and the global facial movement of fearful–neutral and happy–neutral expressions over the 400–1000 ms time courses of the top and middle panels of (A and B), covering a time over which the expressions fully emerge (indicated by gray lines in middle panels of A and B). Time courses of facial expressions (A and B top) represent the time-dependent, frame-to-frame differential facial movement (relative to neutral dynamic expressions) as the fearful and happy dynamic expressions emerged; these time points were averaged over the fearful and happy videos, respectively; the time-course data depicting fearful and happy facial expressions (relative to neutral expressions) consists of the stimulus time courses shown earlier in Jabbi et al. (2013).

