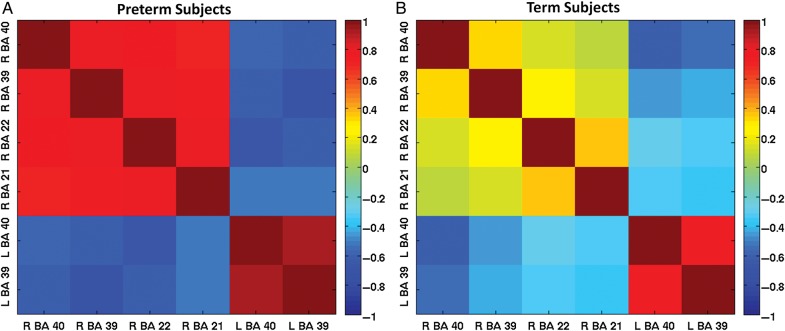
Figure 4.
Correlation matrices of connectivity laterality. (A) For the very preterm participants, the average ch-ICD values in the 6 ROIs identified in Figure 2 were highly correlated with each other. (B) For the term participants, the average ch-ICD values in these 6 ROIs were less correlated. For the very preterm participants, these ROIs act together when modulating the laterality of their connectivity; whereas, for the term subjects, these ROIs act more independent from each other.

